
 EN
EN
 ar
ar bg
bg hr
hr cs
cs da
da nl
nl fi
fi fr
fr de
de el
el hi
hi it
it ko
ko no
no pl
pl pt
pt ro
ro ru
ru es
es sv
sv tl
tl iw
iw id
id lv
lv lt
lt sr
sr sk
sk sl
sl uk
uk vi
vi et
et hu
hu th
th tr
tr fa
fa ms
ms hy
hy ka
ka ur
ur bn
bn mn
mn ta
ta kk
kk uz
uz ku
ku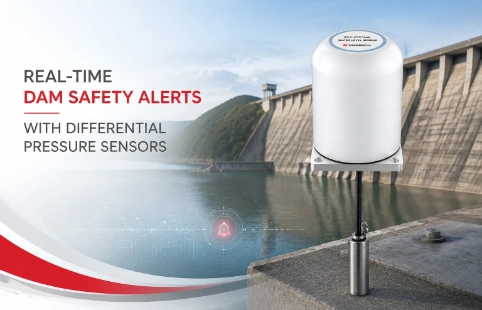
Real-Time Dam Safety Alerts with Differential Pressure Water Level Sensors
Key Takeaways An alert chain needs more than a sensor: define field in...

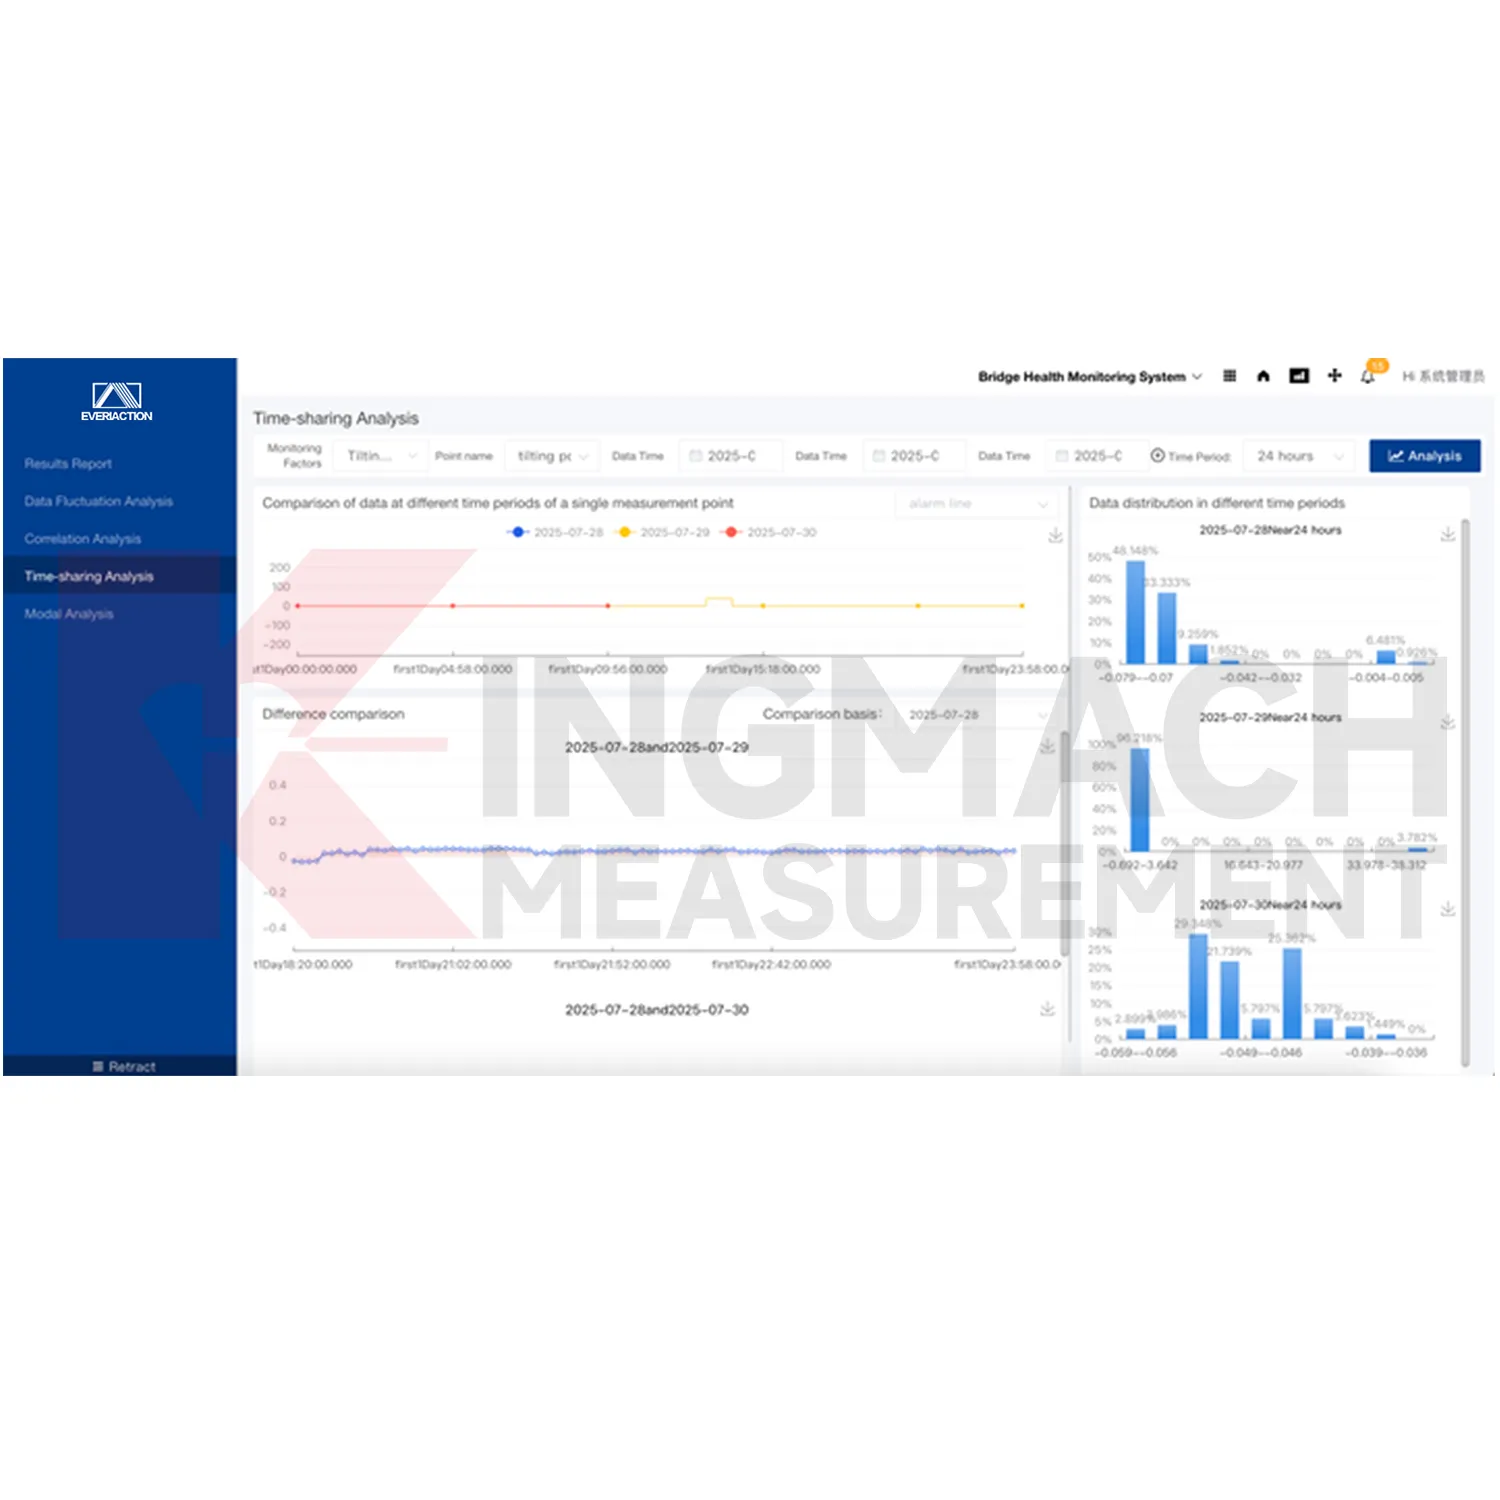
Visualization Software for Geotechnical Data
Engineers managing geotechnical projects often deal with data from dozens of sensors—inclinometers, piezometers, strain gauges. Raw numbers don’t tell the full story until patterns emerge. That’s where visualization software becomes a practical necessity. Kingmach’s visualization platform organizes this data into clear, interactive views, allowing teams to spot deformation trends, pore pressure changes, or structural shifts early. It’s built specifically for geotechnical and monitoring applications, not generic business charts. The interface pulls data directly from Kingmach instruments and compatible third-party devices, processing it into graphs, contour maps, and real-time dashboards. You don’t need to be a data scientist to interpret what’s happening on-site. The goal is to shorten the gap between measurement and decision, especially when safety margins are tight. This software grew out of feedback from field engineers who wanted simpler, faster access to measurement histories without jumping between multiple tools. It sits at the center of a monitoring ecosystem, turning scattered data points into a readable narrative.
Technical Detail
Kingmach’s visualization software is designed side by side with its geotechnical instruments, ensuring clean data flow from sensor to screen. Instead of wrestling with data export-import routines, users see readings update automatically—whether it’s an in-place inclinometer chain showing lateral movement or a vibrating wire piezometer tracking groundwater pressure. The software handles multiple data streams simultaneously and presents them on a unified timeline, making it easier to correlate different measurements. For example, you might compare rainfall data with slope displacement to assess trigger thresholds. One practical advantage is customizable dashboard templates. Unlike one-size-fits-all tools, the layout can be adapted to project needs: a tunnel monitoring team might prioritize deformation cross-sections, while a dam safety group focuses on seepage vectors. Alarms can be set based on rate-of-change or absolute thresholds, with notifications sent via email or SMS. This reduces the need for constant manual checking. Kingmach maintains a global distribution network, and the software includes multi-language support and remote access capabilities. Field data can be viewed from a browser, allowing consultants and project owners to check conditions without traveling to the site. Historical data retrieval is straightforward, useful for long-term trend analysis or compliance reporting.
News
Key Takeaways An alert chain needs more than a sensor: define field in...
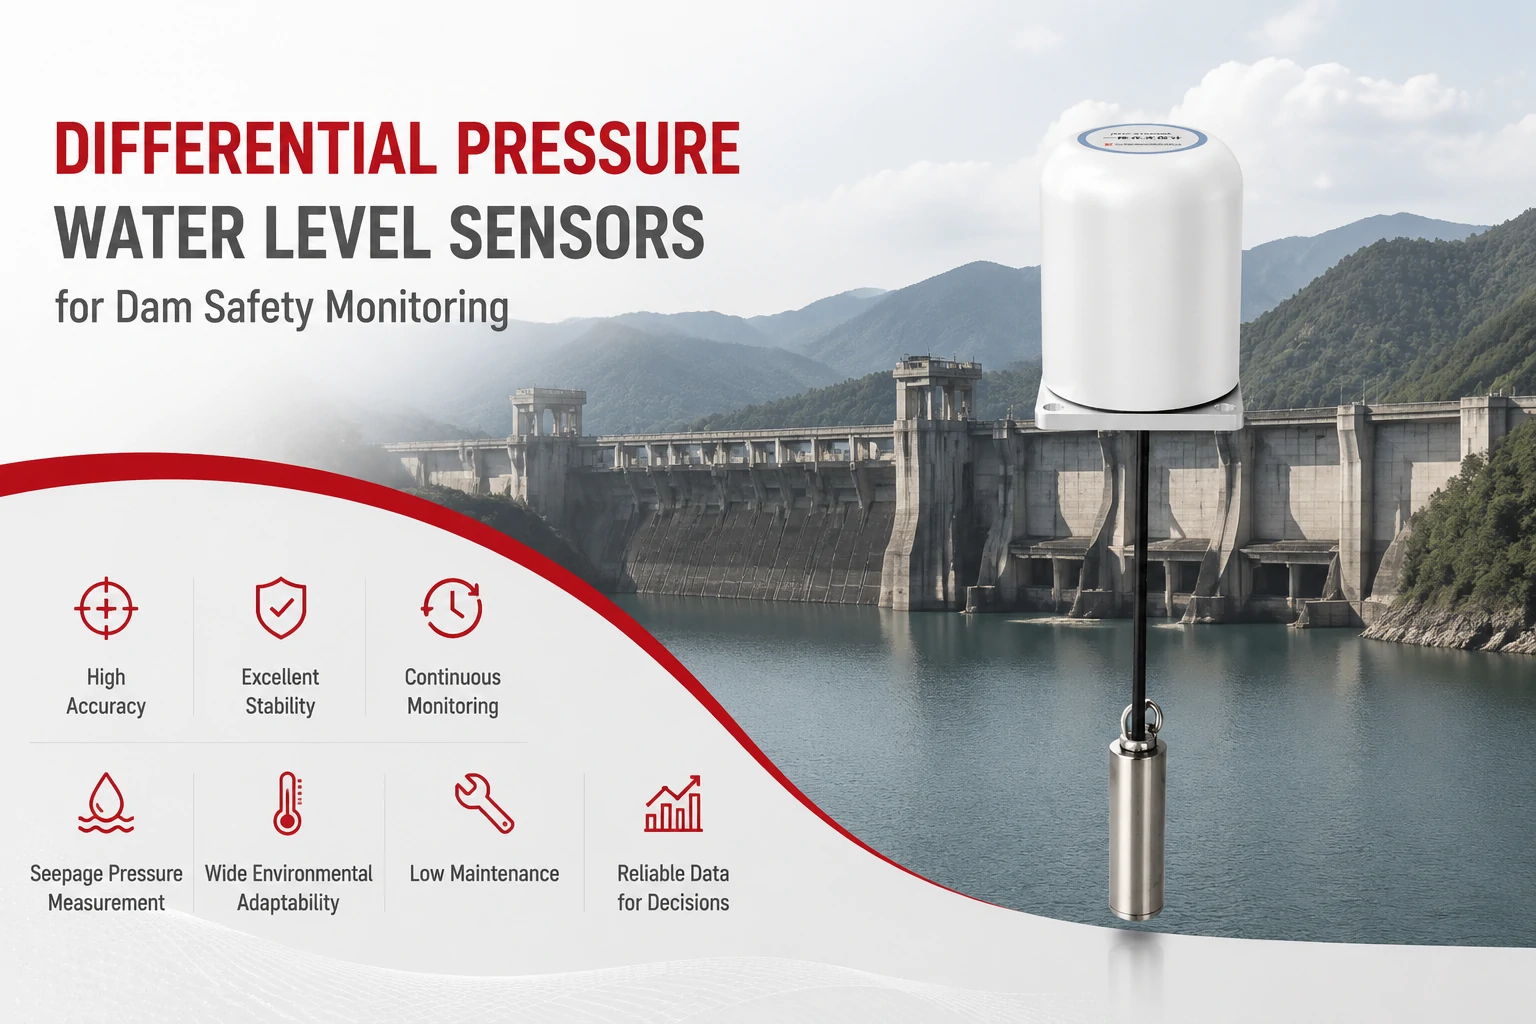
Key Takeaways The strongest fit is usually a confined, submerged, or s...
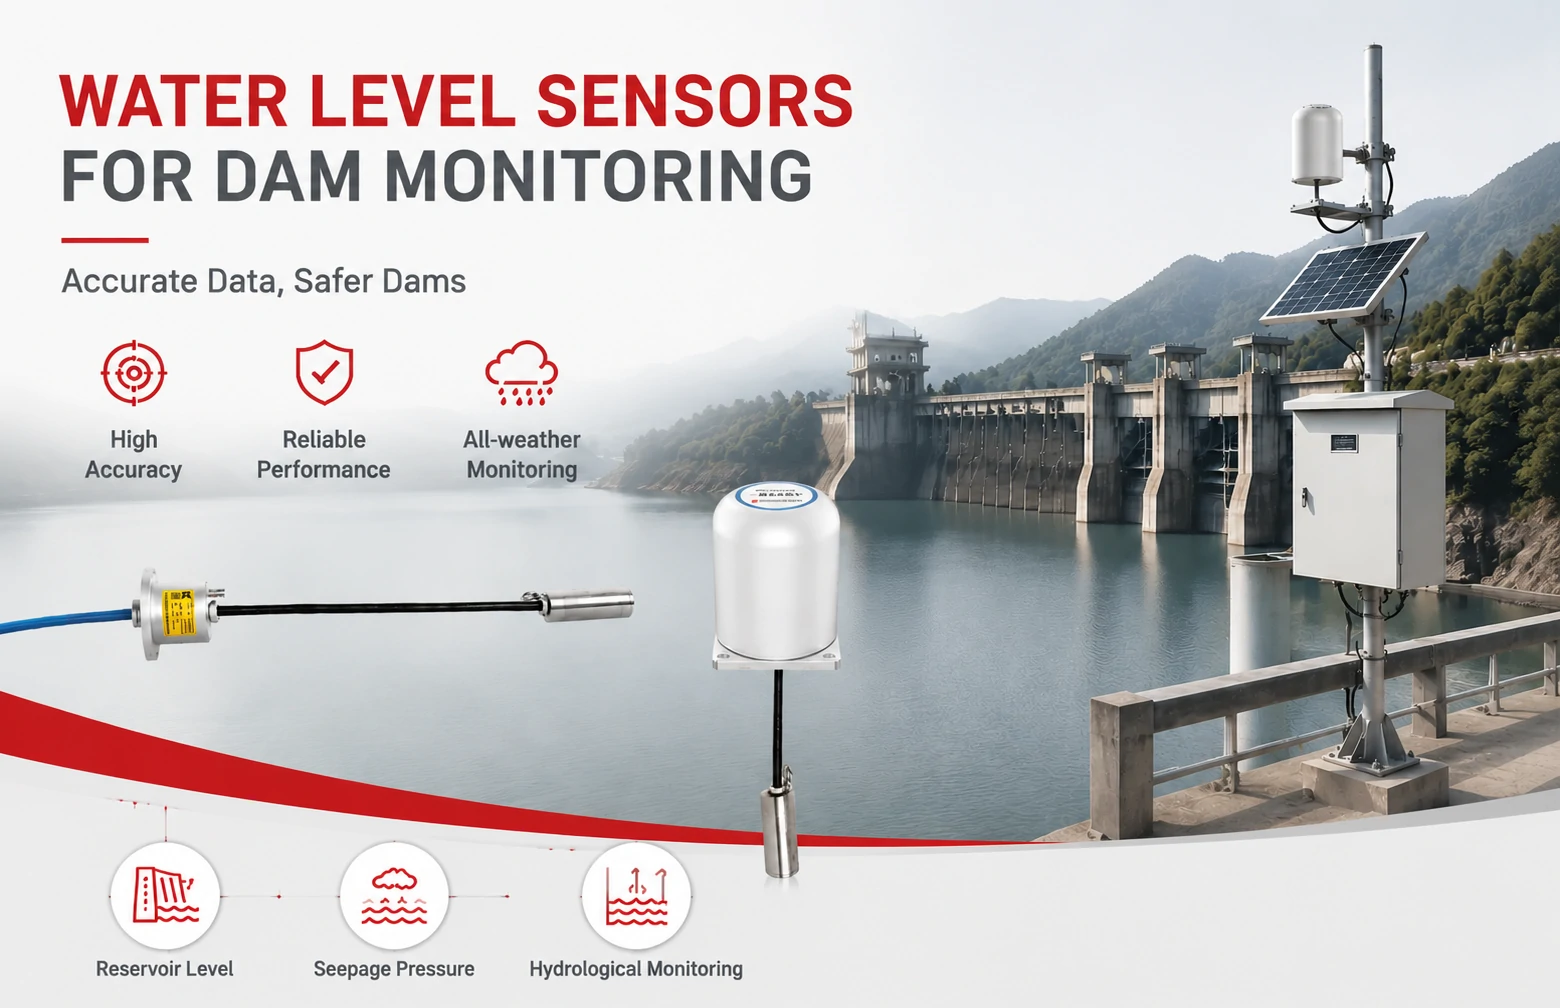
Kingmach Water Level Sensors for Dam Monitoring: A Buyer's Guide to Differential Pre...
Products
FAQ
It works best with Kingmach devices because the communication protocols are native, but it also supports common industry formats like SDI-12 and Modbus. That means you can usually fold in readings from existing compatible sensors without replacing everything. Our support team can help map the data if the setup is non-standard.
The software doesn’t rely on a constant cloud connection for data collection. The on-site logger or gateway stores data locally and syncs when the connection is restored. So you won’t lose measurements during outages. The visualization updates automatically after syncing.
It scales down fine. You don’t need a massive installation to benefit. Even a handful of sensors become easier to manage when you can see their output on one screen instead of spreadsheet cells. Licensing options reflect project size, so you’re not paying for capacity you don’t use.
The interface was designed with input from folks who spend more time outdoors than at a desk. Basic navigation—checking readings, zooming into a time range—takes maybe a couple of hours to get comfortable. Advanced configuration, like setting up alarms or custom calculations, might need a more structured training session, which we can arrange.
Yes, you can export graphs as images or data tables as CSV files for use in reports or other analysis software. It keeps the raw data accessible, so you’re not trapped in a proprietary format.
Share your product type, target capacity, and application requirements. Our team can review the details and recommend a practical next step.
If you are interested in our products or want to become our partner.
Please leave your contact information, our team will contact you as soon as possible.
Mail: [email protected]
Contact Us: +8613808434127
Address: No. 188 Tongzipo West Rd, Changsha, Hunan, China