 ar
ar bg
bg hr
hr cs
cs da
da nl
nl fi
fi fr
fr de
de el
el hi
hi it
it ko
ko no
no pl
pl pt
pt ro
ro ru
ru es
es sv
sv tl
tl iw
iw id
id lv
lv lt
lt sr
sr sk
sk sl
sl uk
uk vi
vi et
et hu
hu th
th tr
tr fa
fa ms
ms hy
hy ka
ka ur
ur bn
bn mn
mn ta
ta kk
kk uz
uz ku
ku
load cell connection diagram
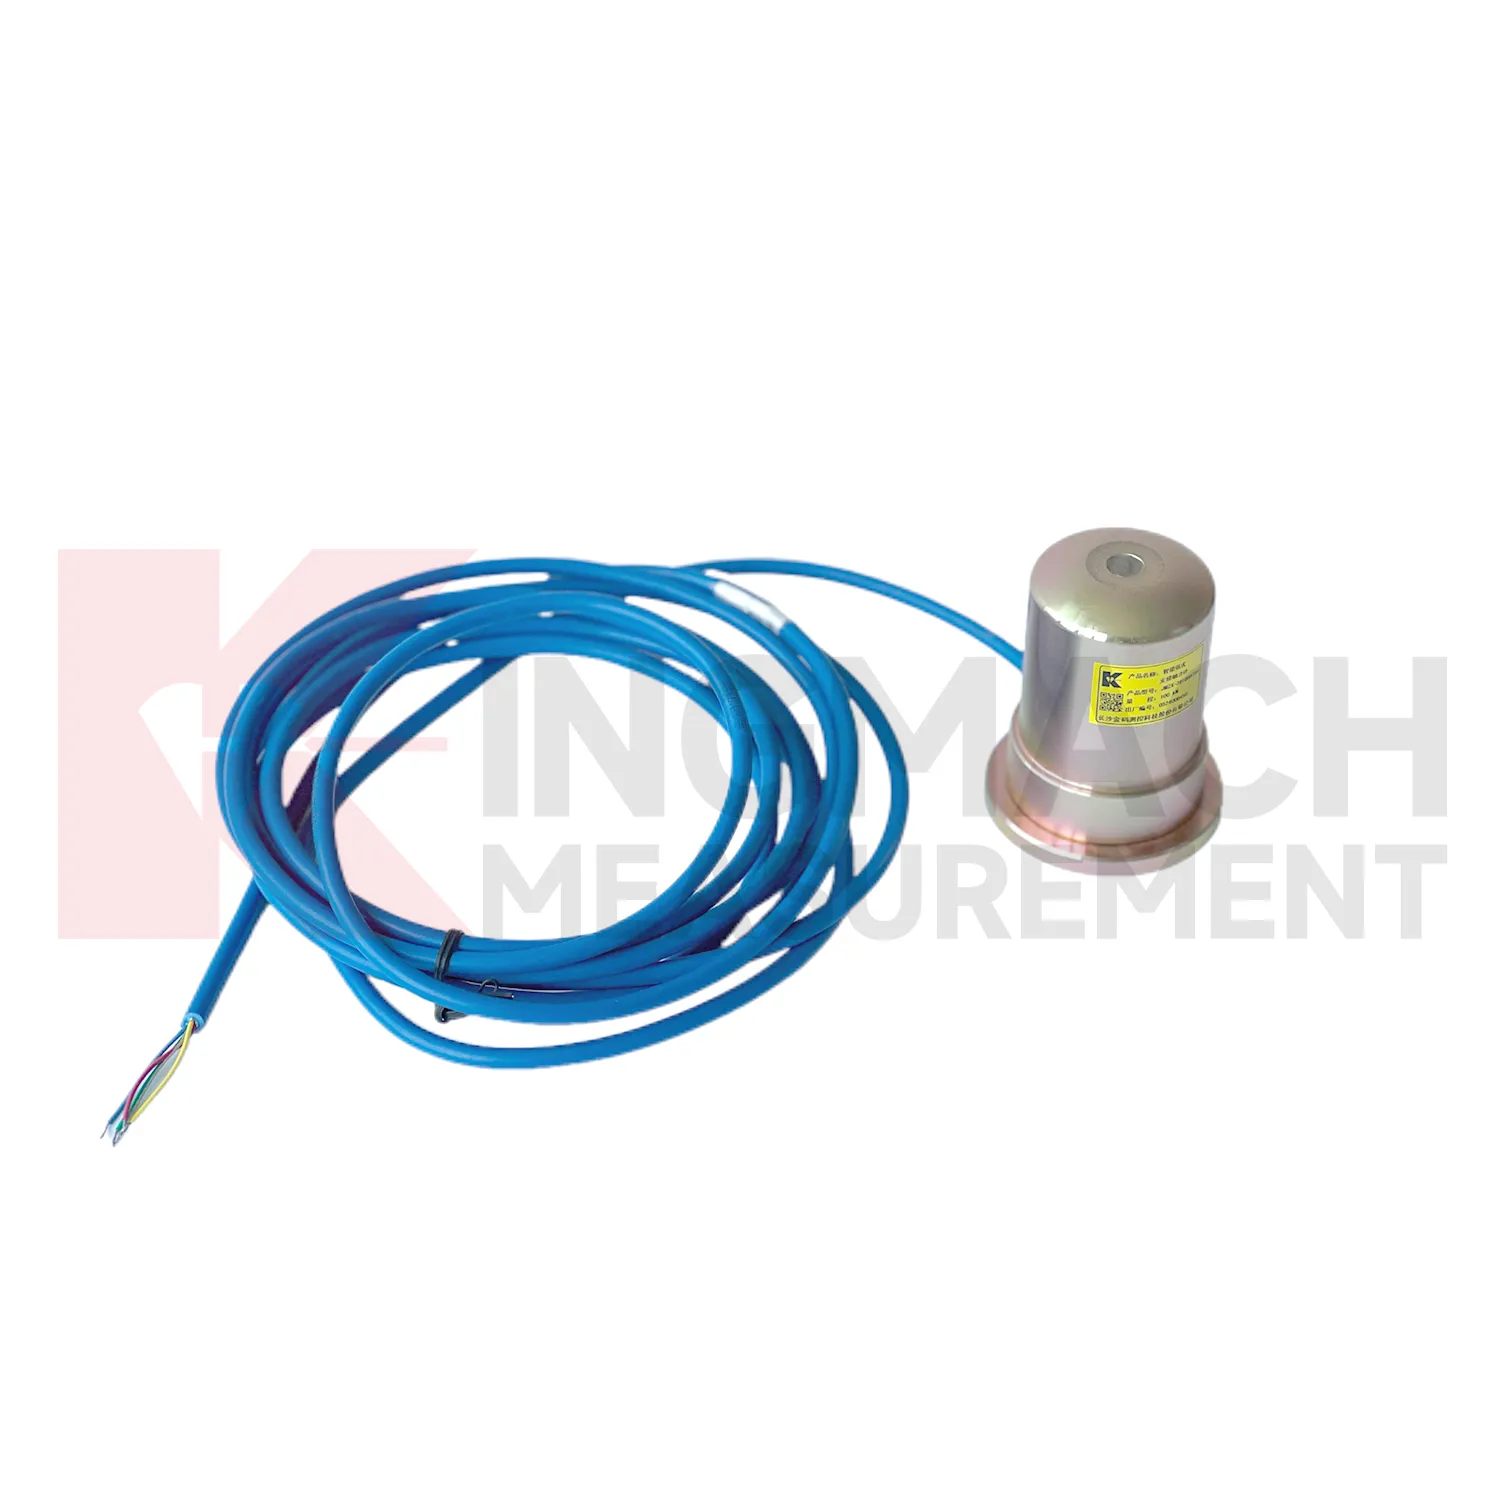
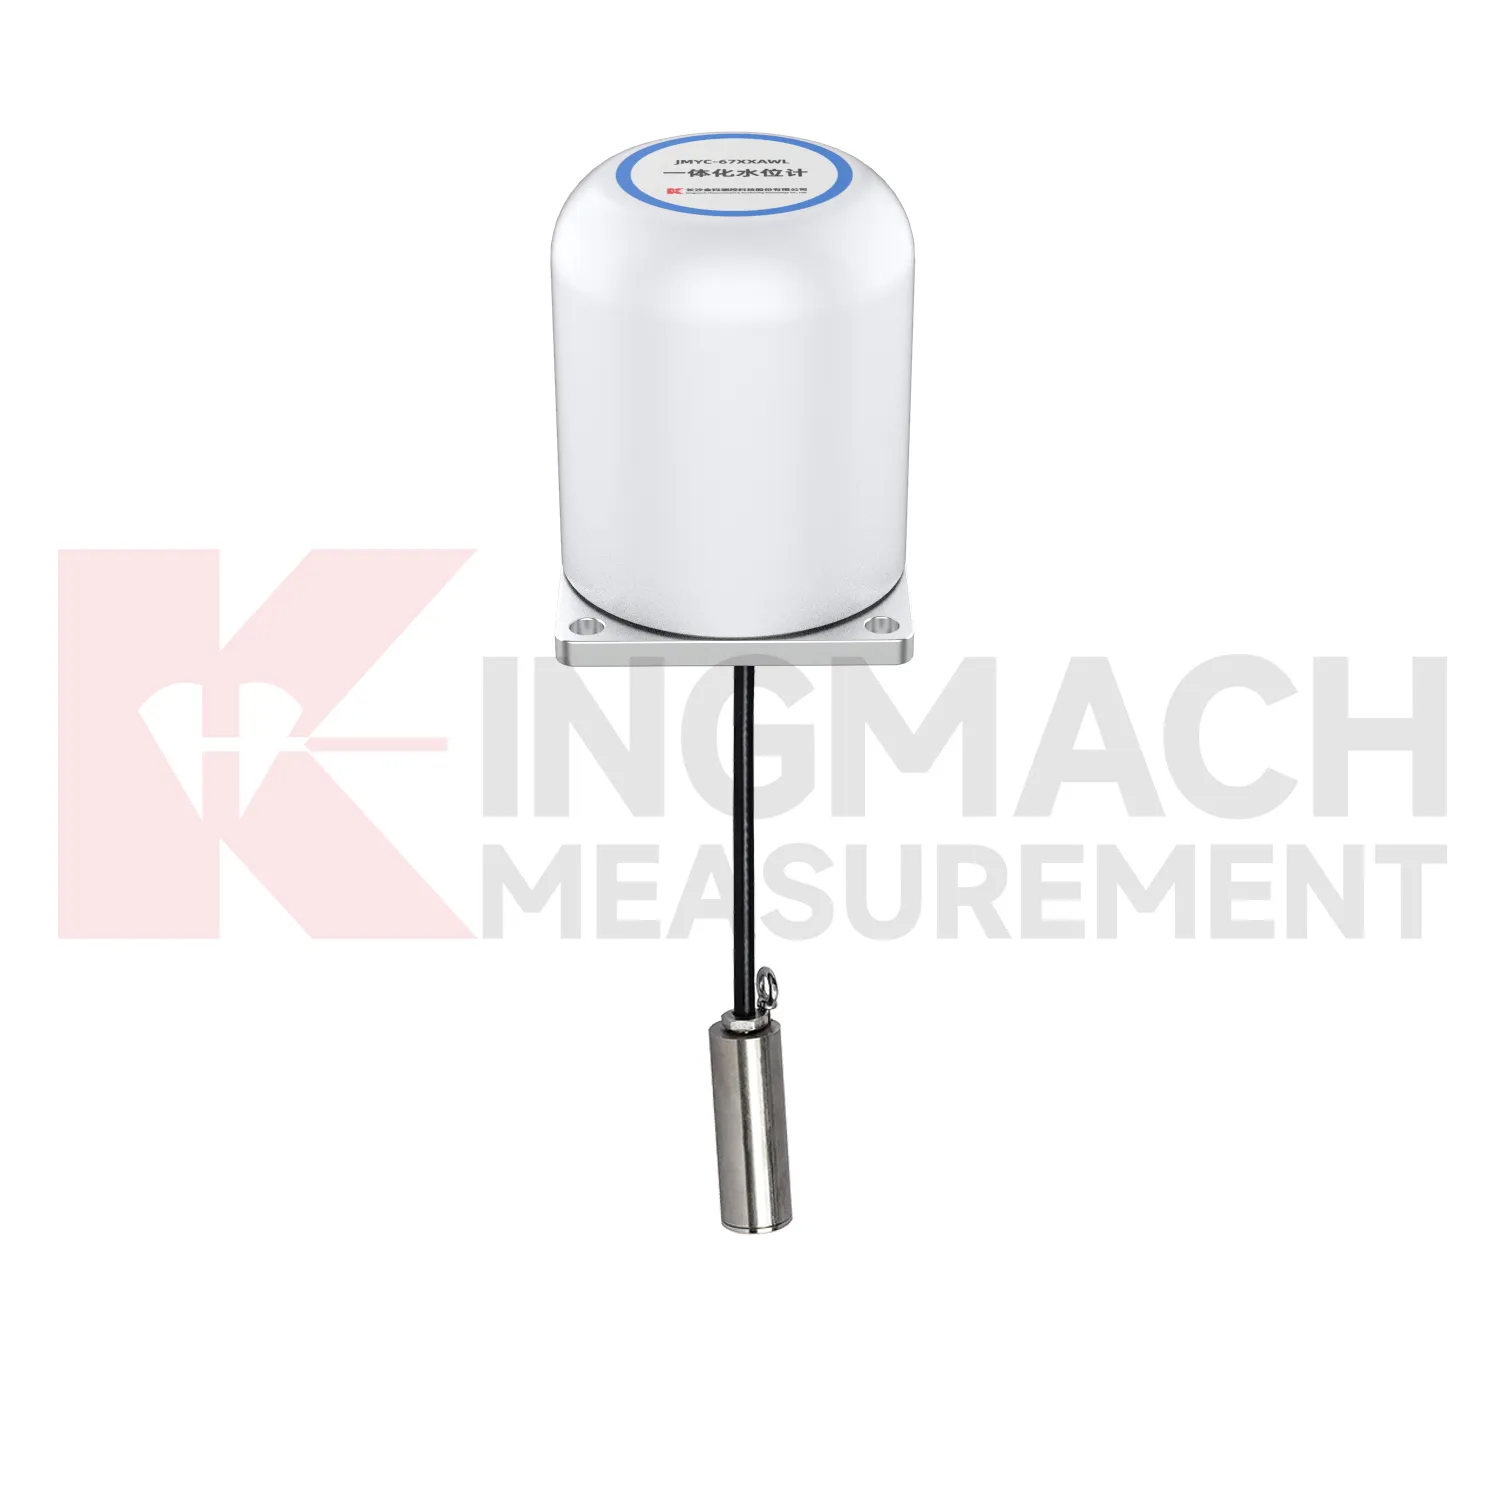
Kingmach load cell connection diagram can be specified as part of a complete monitoring workflow rather than as a standalone instrument. Product pages mention manual readout compatibility, comprehensive vibrating wire readouts, automated acquisition, and storage of model or calibration information inside smart sensors. On listed models, force ranges extend from 200 kN on smaller axial force meters to 10000 kN on high capacity solid load cells, while pressure related models cover 0.3 MPa to 8 MPa. The presence of temperature correction, waterproof construction, digital output, and stable vibrating wire sensing helps the same installation work through construction and service periods. Kingmach's support range includes data loggers, instrumentation cables, and visualization software, so project teams can plan channel naming, alarm limits, report format, and maintenance inspection around the sensor from the beginning. That reduces later confusion when hundreds of monitoring points are installed across a bridge, subway, dam, slope, or foundation project. Viewed as a package, the product, readout, cable, calibration record, and software connection all affect data quality. Kingmach's catalog structure helps buyers think about that whole chain rather than treating the sensor as a loose component. For long projects, that shared record reduces confusion when installation teams, monitoring teams, and maintenance teams are not the same people.
Application of load cell connection diagram
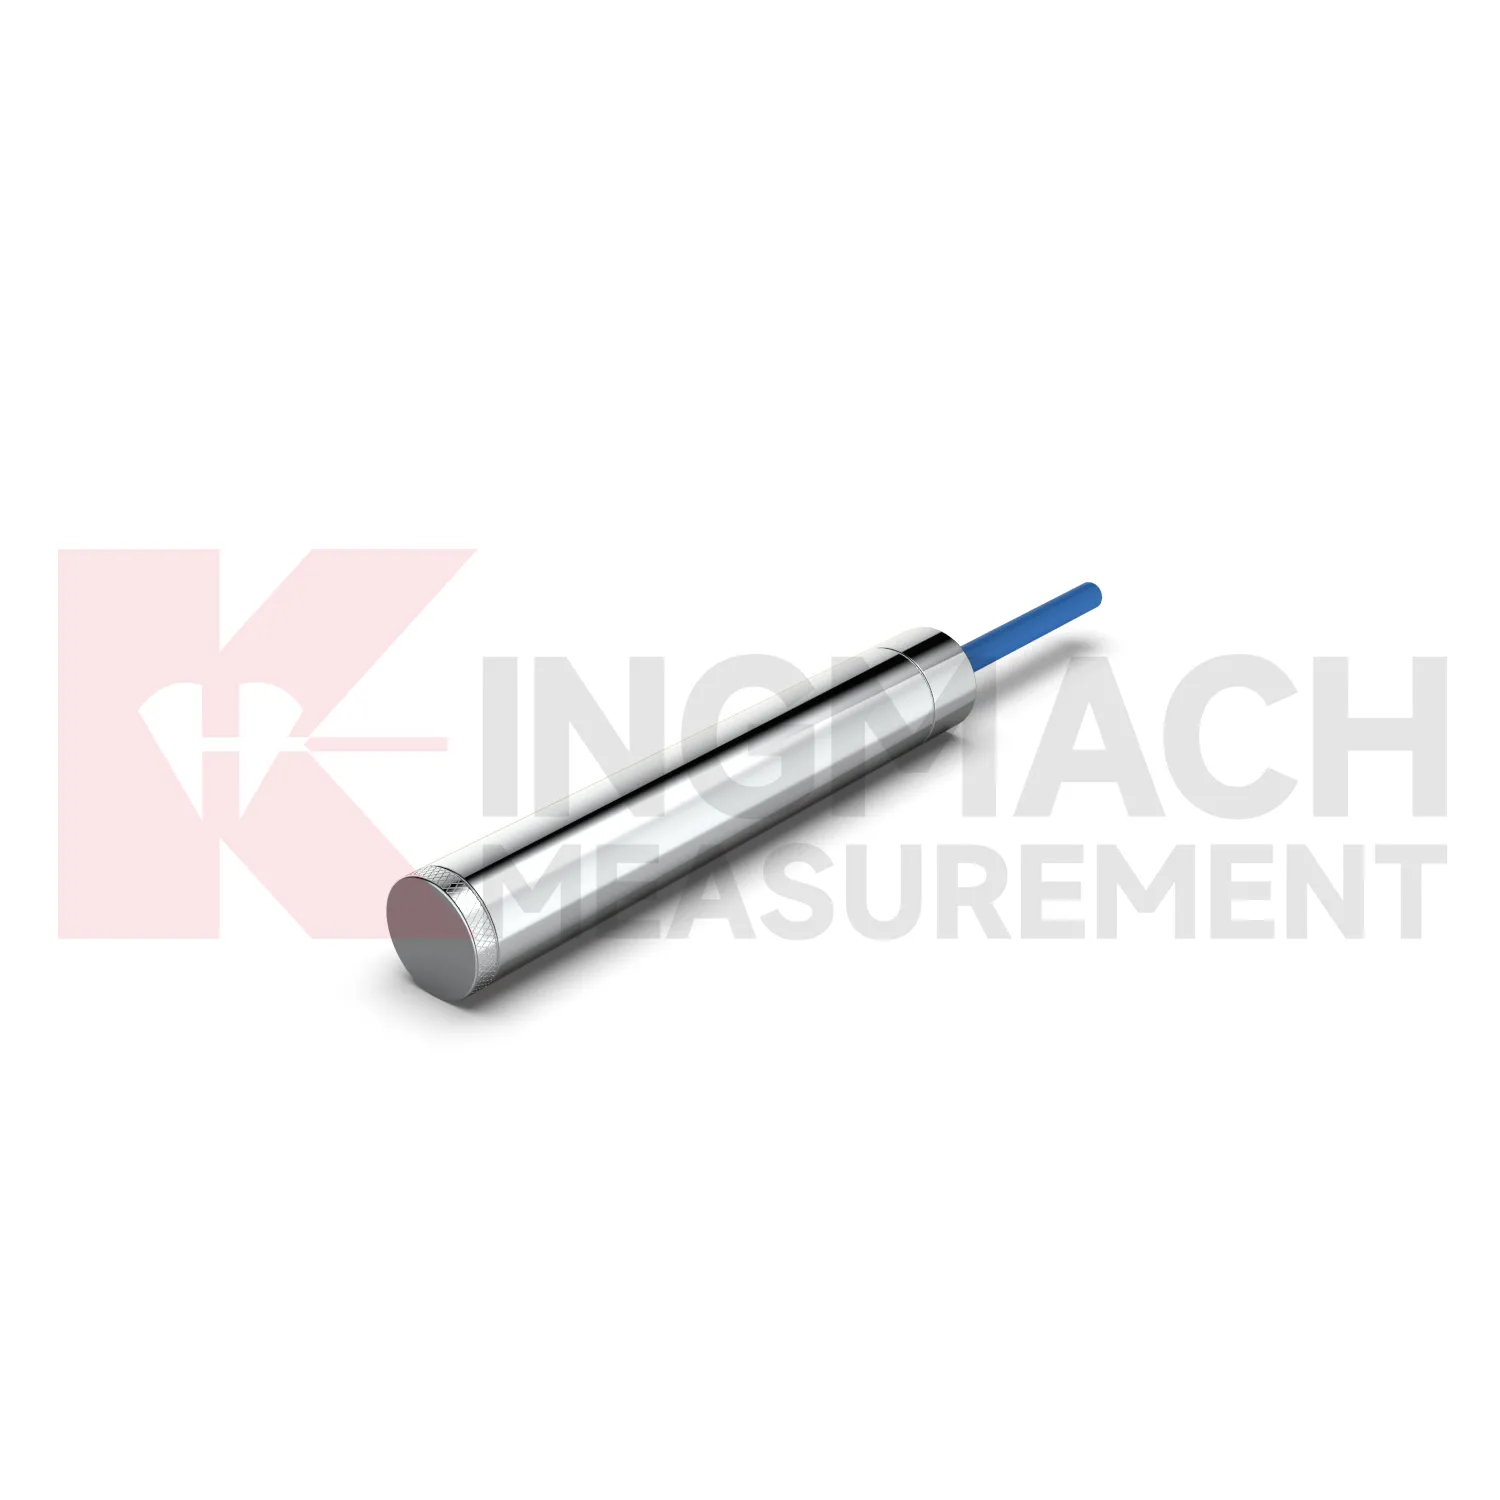
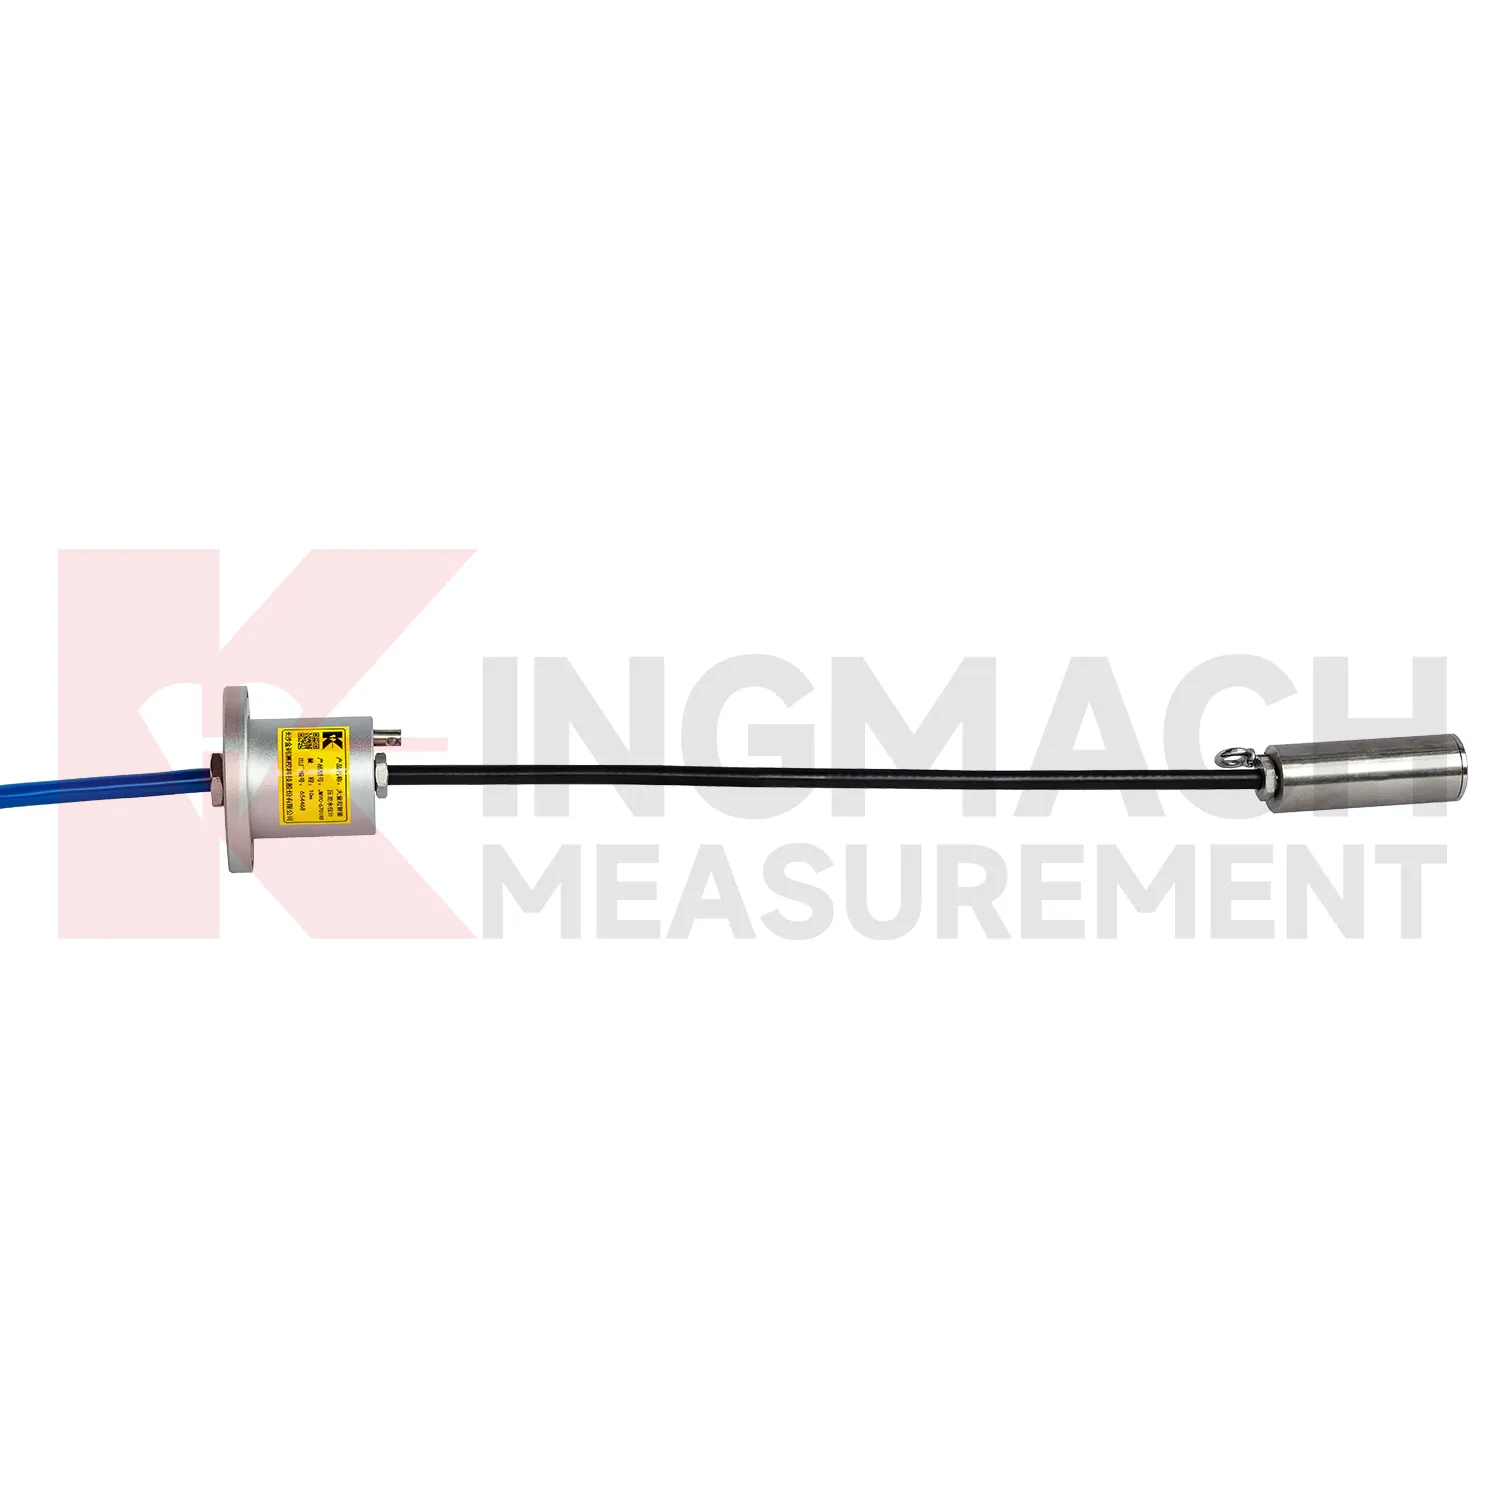
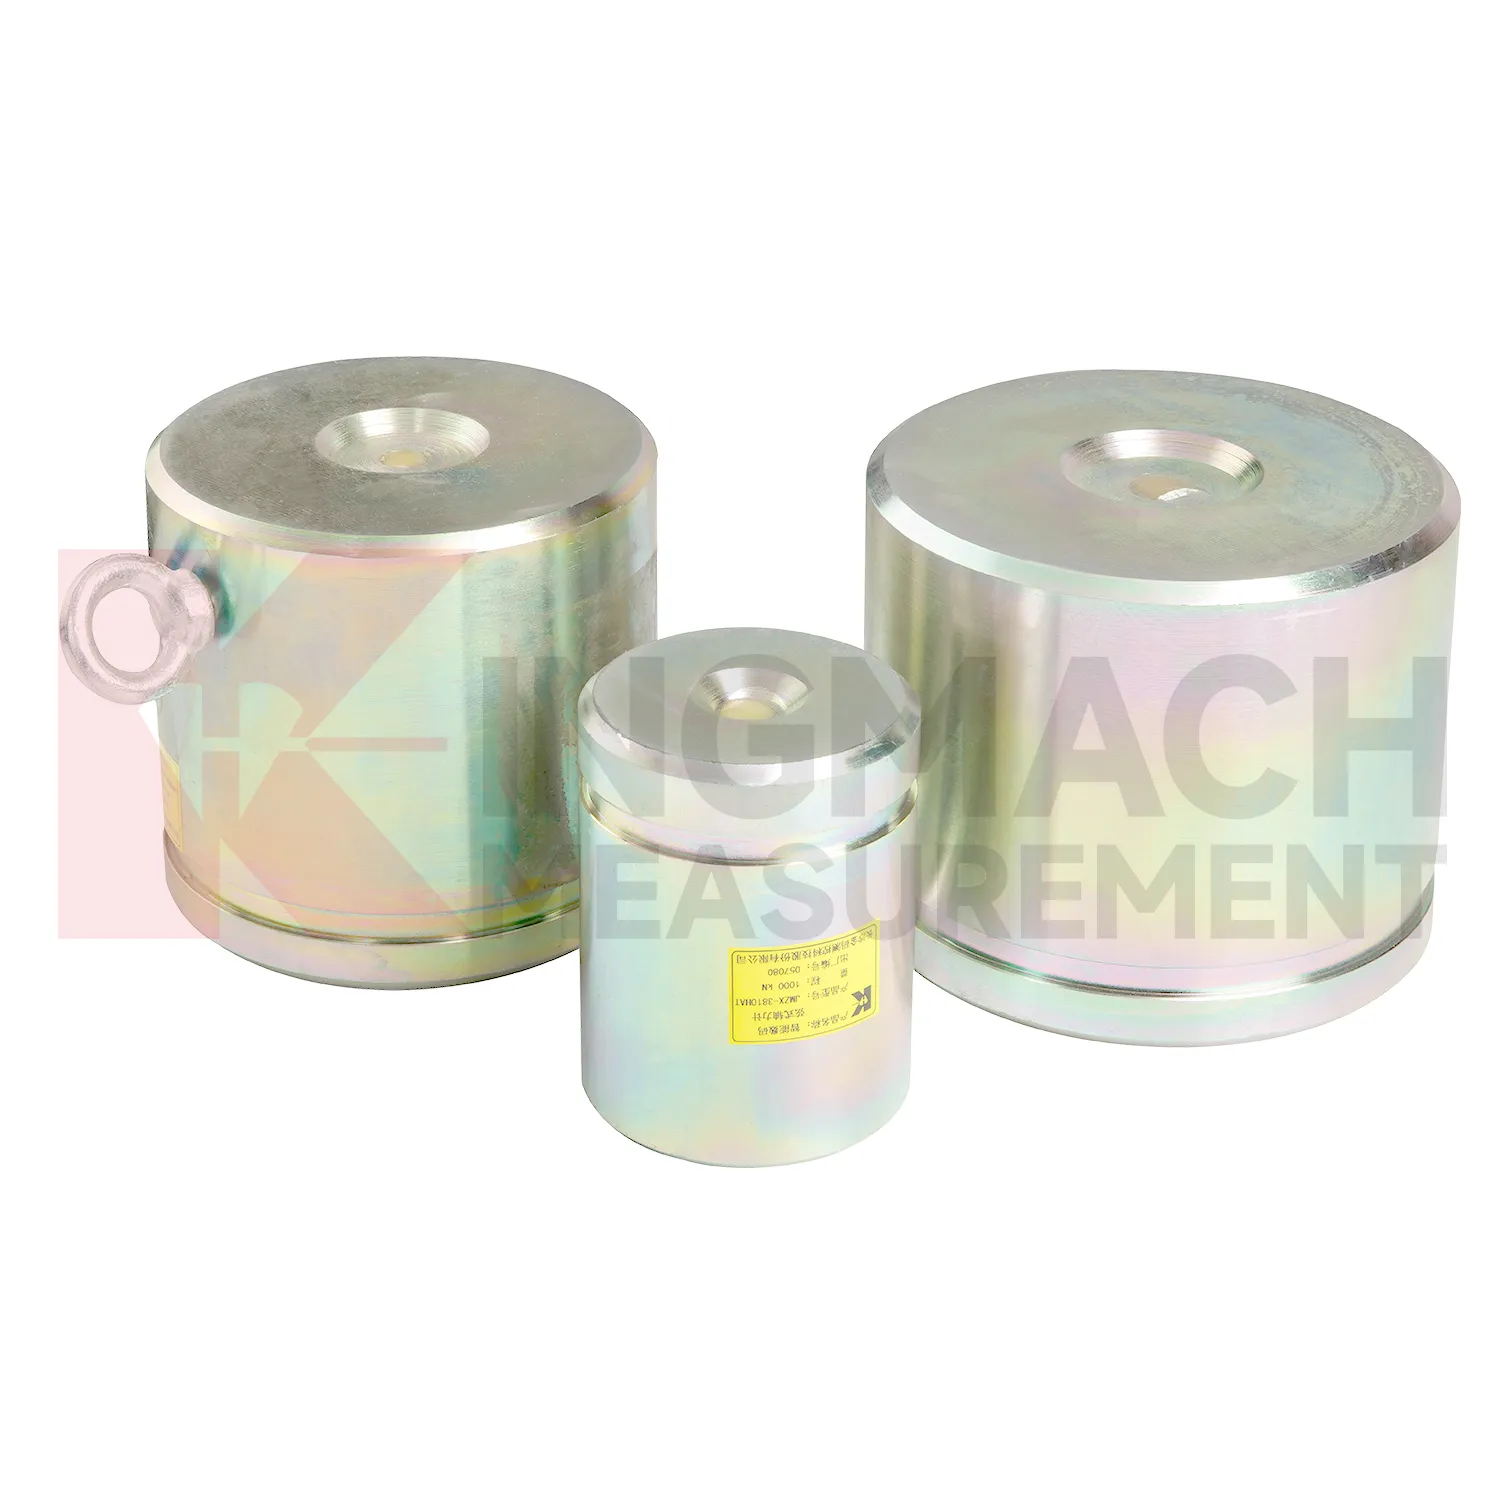
In industrial force testing and heavy equipment monitoring, load cell connection diagram can be applied to presses, jacks, lifting frames, cranes, test benches, fixtures, and custom loading rigs. The pain point is repeatability. A test may pass once, but the owner needs to know whether the next test used the same loading path, sensor range, and calibration basis. Kingmach solid load cells provide high capacity force measurement up to 10000 kN with 0.5%FS precision, while hollow load cells cover 500 kN to 8000 kN and can store 800 measurement records on smart models. Axial force meters provide 200 kN to 3000 kN ranges and direct kN display. These features suit both site acceptance testing and repeated equipment checks. Installation should control centering, bearing plate flatness, side loading, cable strain relief, and zero reading before load is applied. Data becomes stronger when the report records operator, fixture condition, load stage, temperature, and any overload event. For test benches, repeatability also depends on fixture stiffness, alignment, and loading rate. A high accuracy sensor cannot correct a poor mechanical setup, so maintenance should include the test frame and not only the measuring element. The monitoring plan should also define who reviews abnormal data and how quickly a field check must follow a confirmed alarm.
The future of load cell connection diagram
Future load cell connection diagram use will depend on cleaner data pipelines, not only stronger metal parts. Kingmach's smart load cell features, including digital output, long distance transmission, anti-interference performance, temperature correction, and stored parameters, already point toward connected monitoring. In the next few years, more projects are likely to use edge acquisition units that check whether a reading is plausible before it reaches the platform. A sudden force jump can be compared with temperature, cable condition, nearby displacement, and recent construction events. AI based warning tools may help sort routine fluctuation from patterns that deserve inspection, but they will only work when the instrument record is consistent. That places more value on channel naming, calibration certificates, zero checks, installation photos, and maintenance logs. The product direction is therefore practical: robust sensing at the point of load, reliable transmission from difficult sites, and software that helps engineers review trends without losing the original measurement context.
Care & Maintenance of load cell connection diagram
For load cell connection diagram used with manual readouts, care depends on repeatable procedure. Before installation, store the calibration sheet with the instrument and confirm that the readout supports the sensor type. Kingmach product pages mention compatible readouts and comprehensive vibrating wire instruments, which can display force values directly on selected models. During installation, label the cable and channel clearly, record the zero value, and protect the connection point from water and pulling. During each reading round, use the same unit, readout setting, point name, and observation sequence. Note temperature, weather, construction activity, and any visible damage near the sensor. Long term maintenance should include connector cleaning, cable jacket inspection, comparison with nearby points, and periodic calibration planning according to project requirements. If a reading seems wrong, repeat it after checking the cable and readout battery. Many apparent sensor faults come from swapped channels, loose connectors, or missing zero records. Use the same readout settings.
Kingmach load cell connection diagram
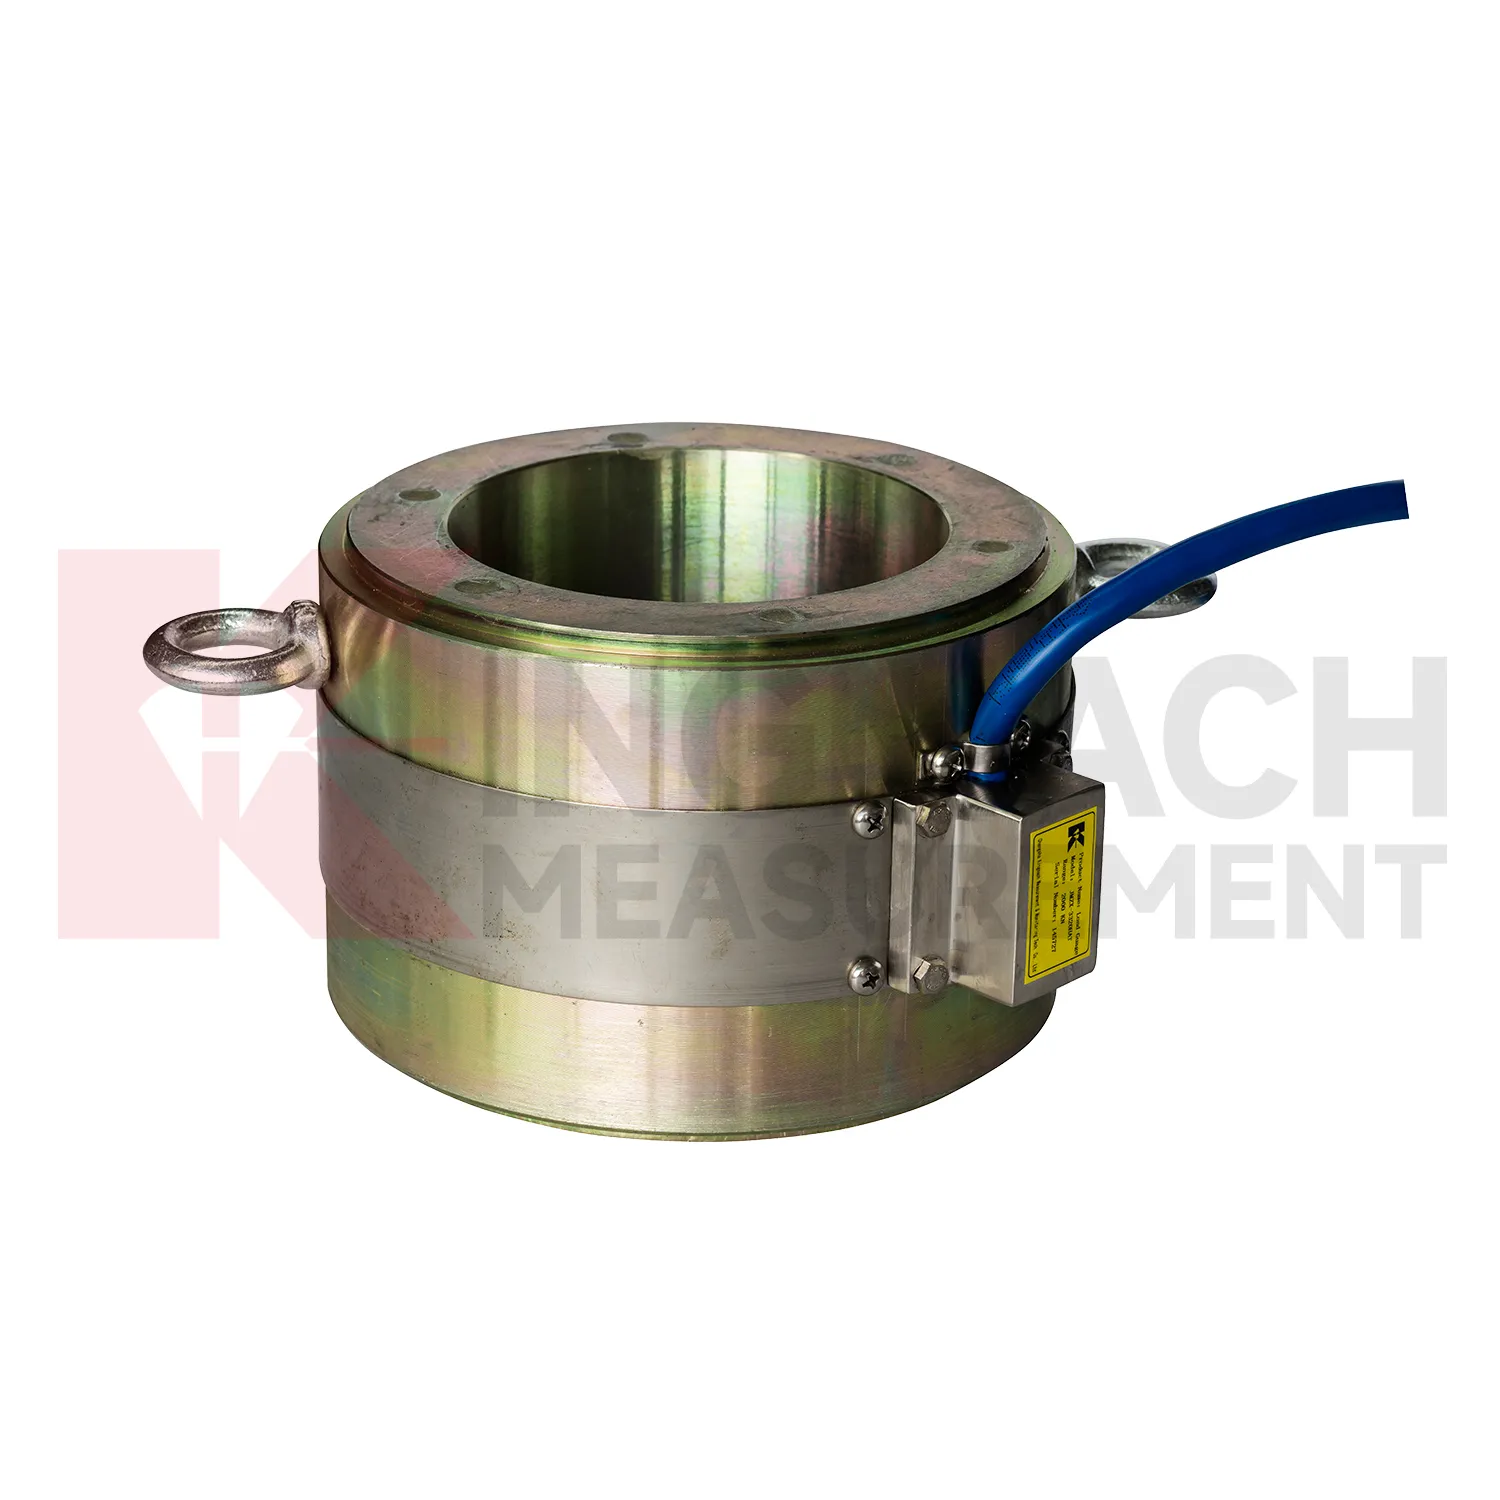
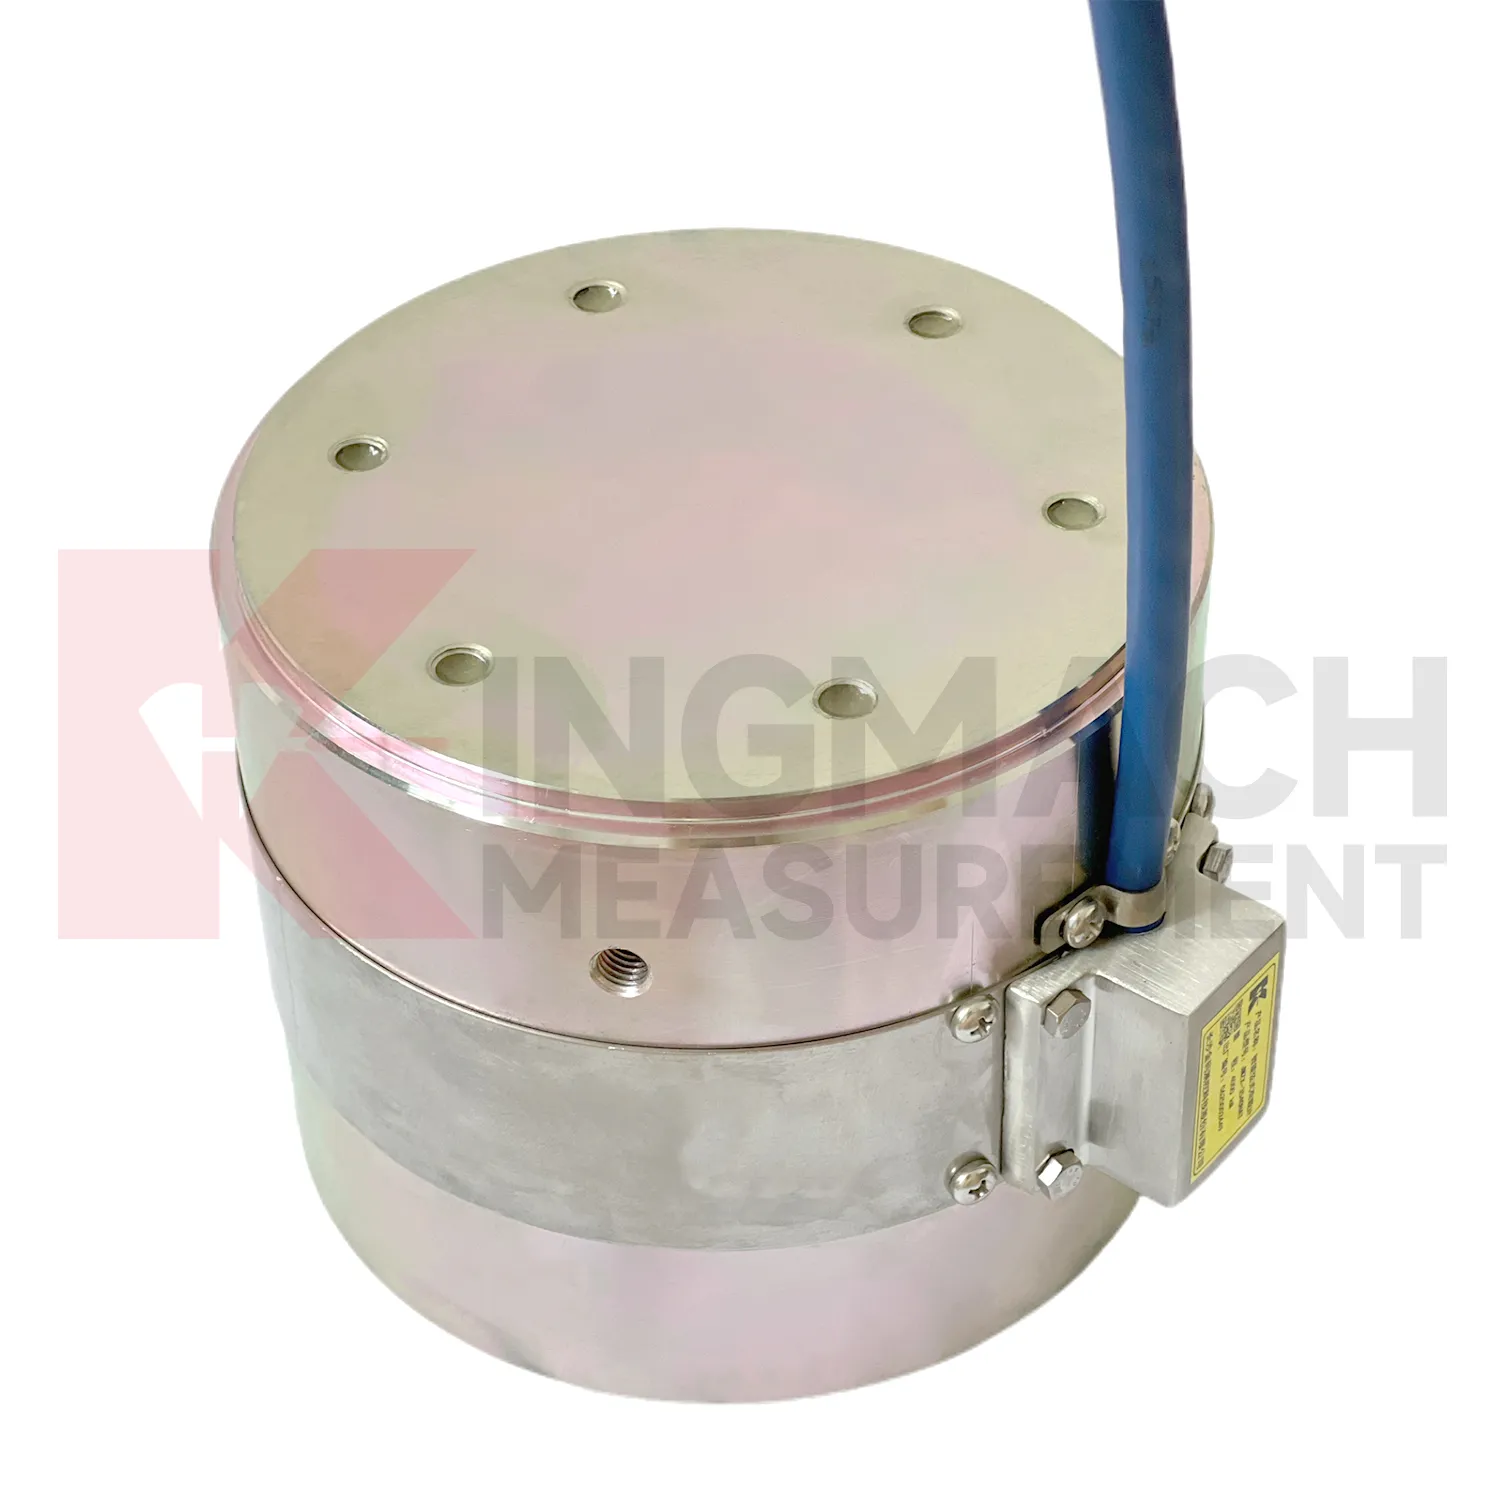
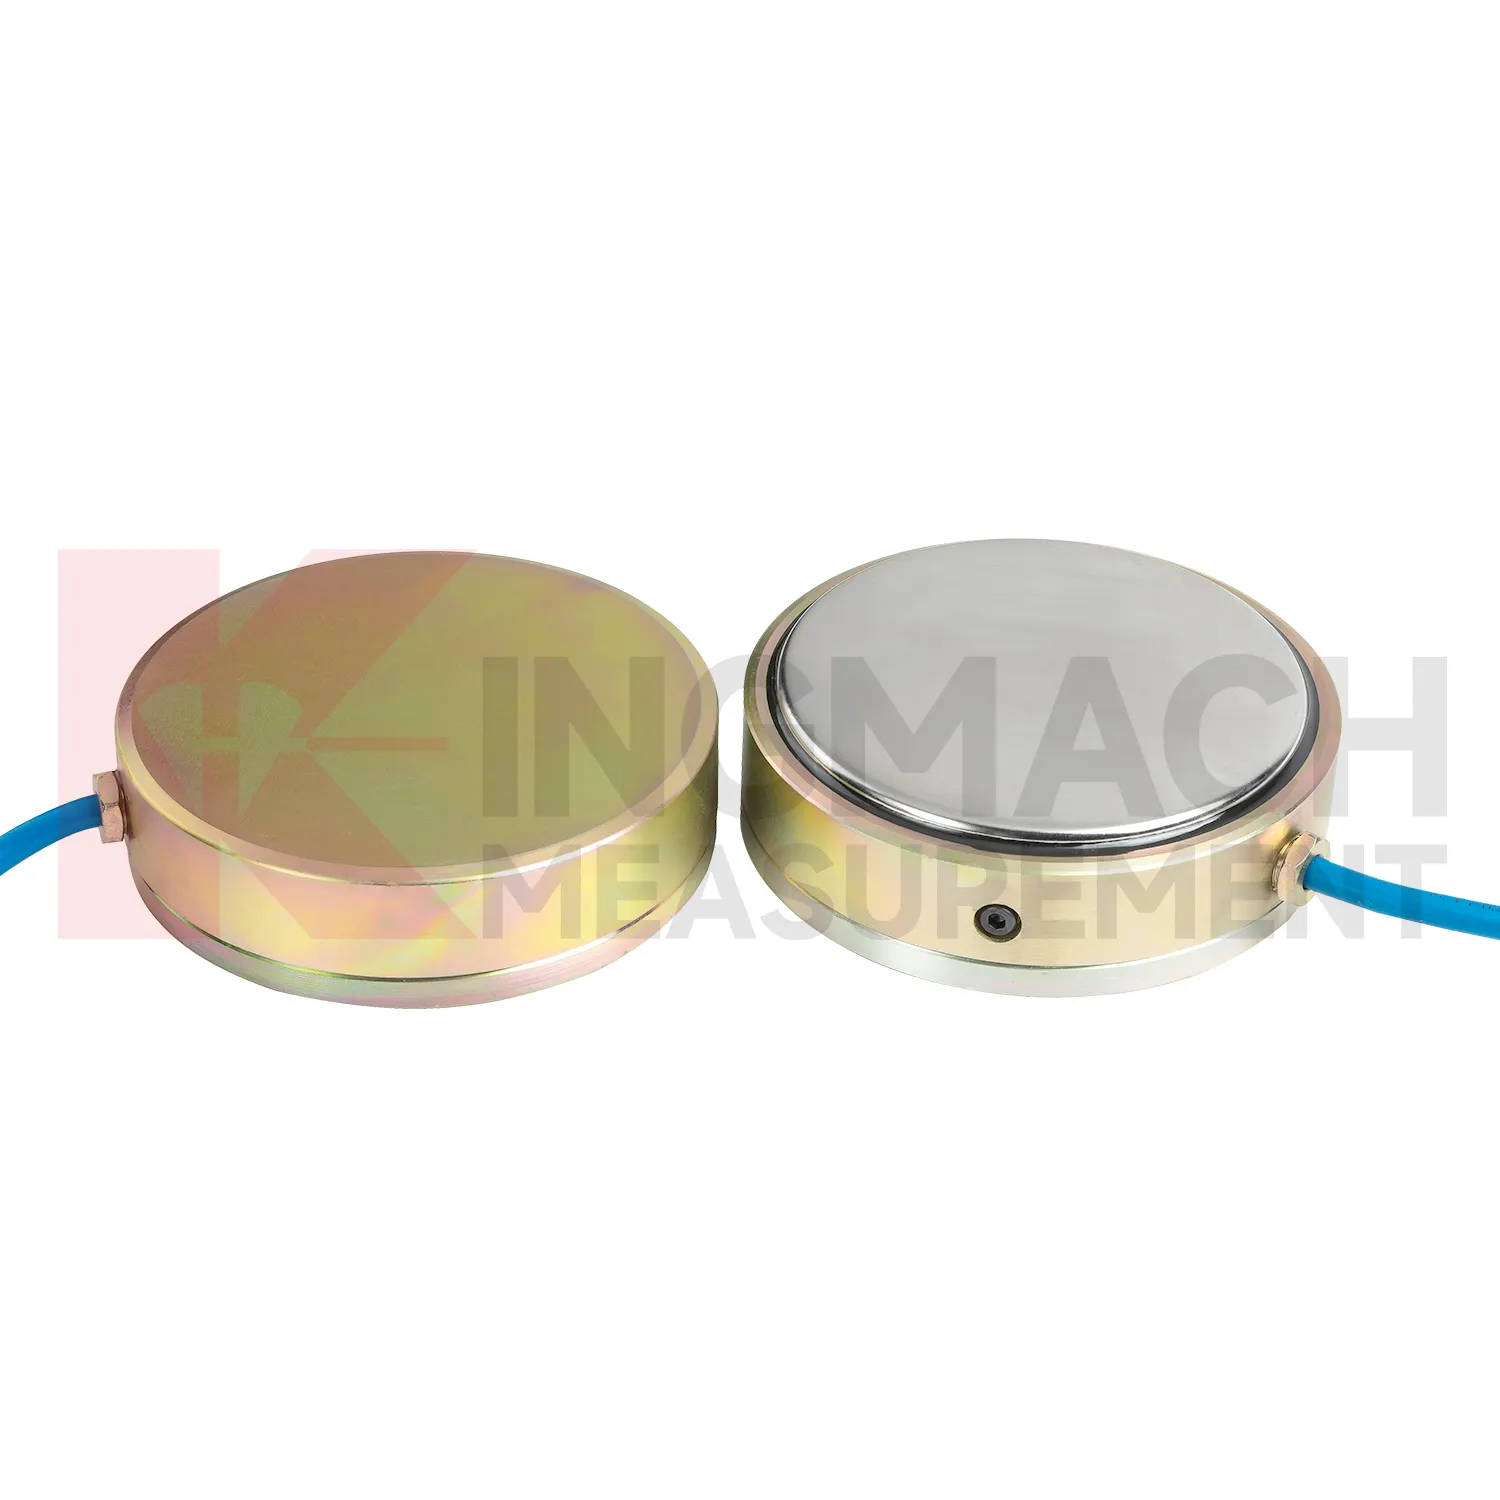
load cell connection diagram can be treated as a field witness for hidden force transfer in civil structures. Concrete, steel, soil, cable systems, and hydraulic loading may all look calm while the internal load path changes. Kingmach products in this category cover hollow load cells for anchors and cables, solid load cells for compression and pile testing, axial force meters for steel support loads, and earth pressure cells for contact pressure. Each type answers a different site question. Has the anchor lost tension? Is a pile test load centered? Is an excavation support taking more force after the next soil layer is removed? Is water pressure pushing the retaining structure harder after rain? The strongest monitoring records combine the sensor model, calibrated coefficient, zero value, temperature, reading time, and construction stage. That record gives owners a way to compare today with last week, last season, or the previous loading step, instead of relying on a single inspection note.
FAQ
Q: How can load cell connection diagram be connected to a monitoring platform? A: Use compatible readouts, acquisition modules, data loggers, DTUs, and software platforms according to site access, cable distance, power, and reporting requirements. Q: What makes smart models useful in large networks? A: Stored model data, calibration coefficients, zero values, temperature data, and measurement records reduce confusion across many channels. Q: Should manual readings still be kept? A: Yes, manual checks are useful after installation, maintenance, abnormal alarms, or logger changes. Q: How should alarm limits be set? A: Base them on design stage, sensor range, expected load change, temperature behavior, and nearby monitoring points. Q: What data should be reviewed together with force? A: Settlement, displacement, tilt, water level, pore pressure, rainfall, temperature, construction events, and inspection notes.
Reviews
Ryan Lewis
Fast delivery and excellent product quality. The accelerometers and tiltmeters are highly reliable. Strongly recommend this company.
Andrew Lee
The visualization software is intuitive and powerful. It helps us analyze monitoring data efficiently.
Latest Inquiries
To protect the privacy of our buyers, only public service email domains like Gmail, Yahoo, and MSN will be displayed. Additionally, only a limited portion of the inquiry content will be shown.
Evelyn***@gmail.comSouth Africa
Hi, we are a contractor working on tunnel construction and need settlement sensors and displacement ...
Amelia***@gmail.comSingapore
Hello, I am looking for visualization software for monitoring system data analysis. Please let me kn...