 ar
ar bg
bg hr
hr cs
cs da
da nl
nl fi
fi fr
fr de
de el
el hi
hi it
it ko
ko no
no pl
pl pt
pt ro
ro ru
ru es
es sv
sv tl
tl iw
iw id
id lv
lv lt
lt sr
sr sk
sk sl
sl uk
uk vi
vi et
et hu
hu th
th tr
tr fa
fa ms
ms hy
hy ka
ka ur
ur bn
bn mn
mn ta
ta kk
kk uz
uz ku
ku
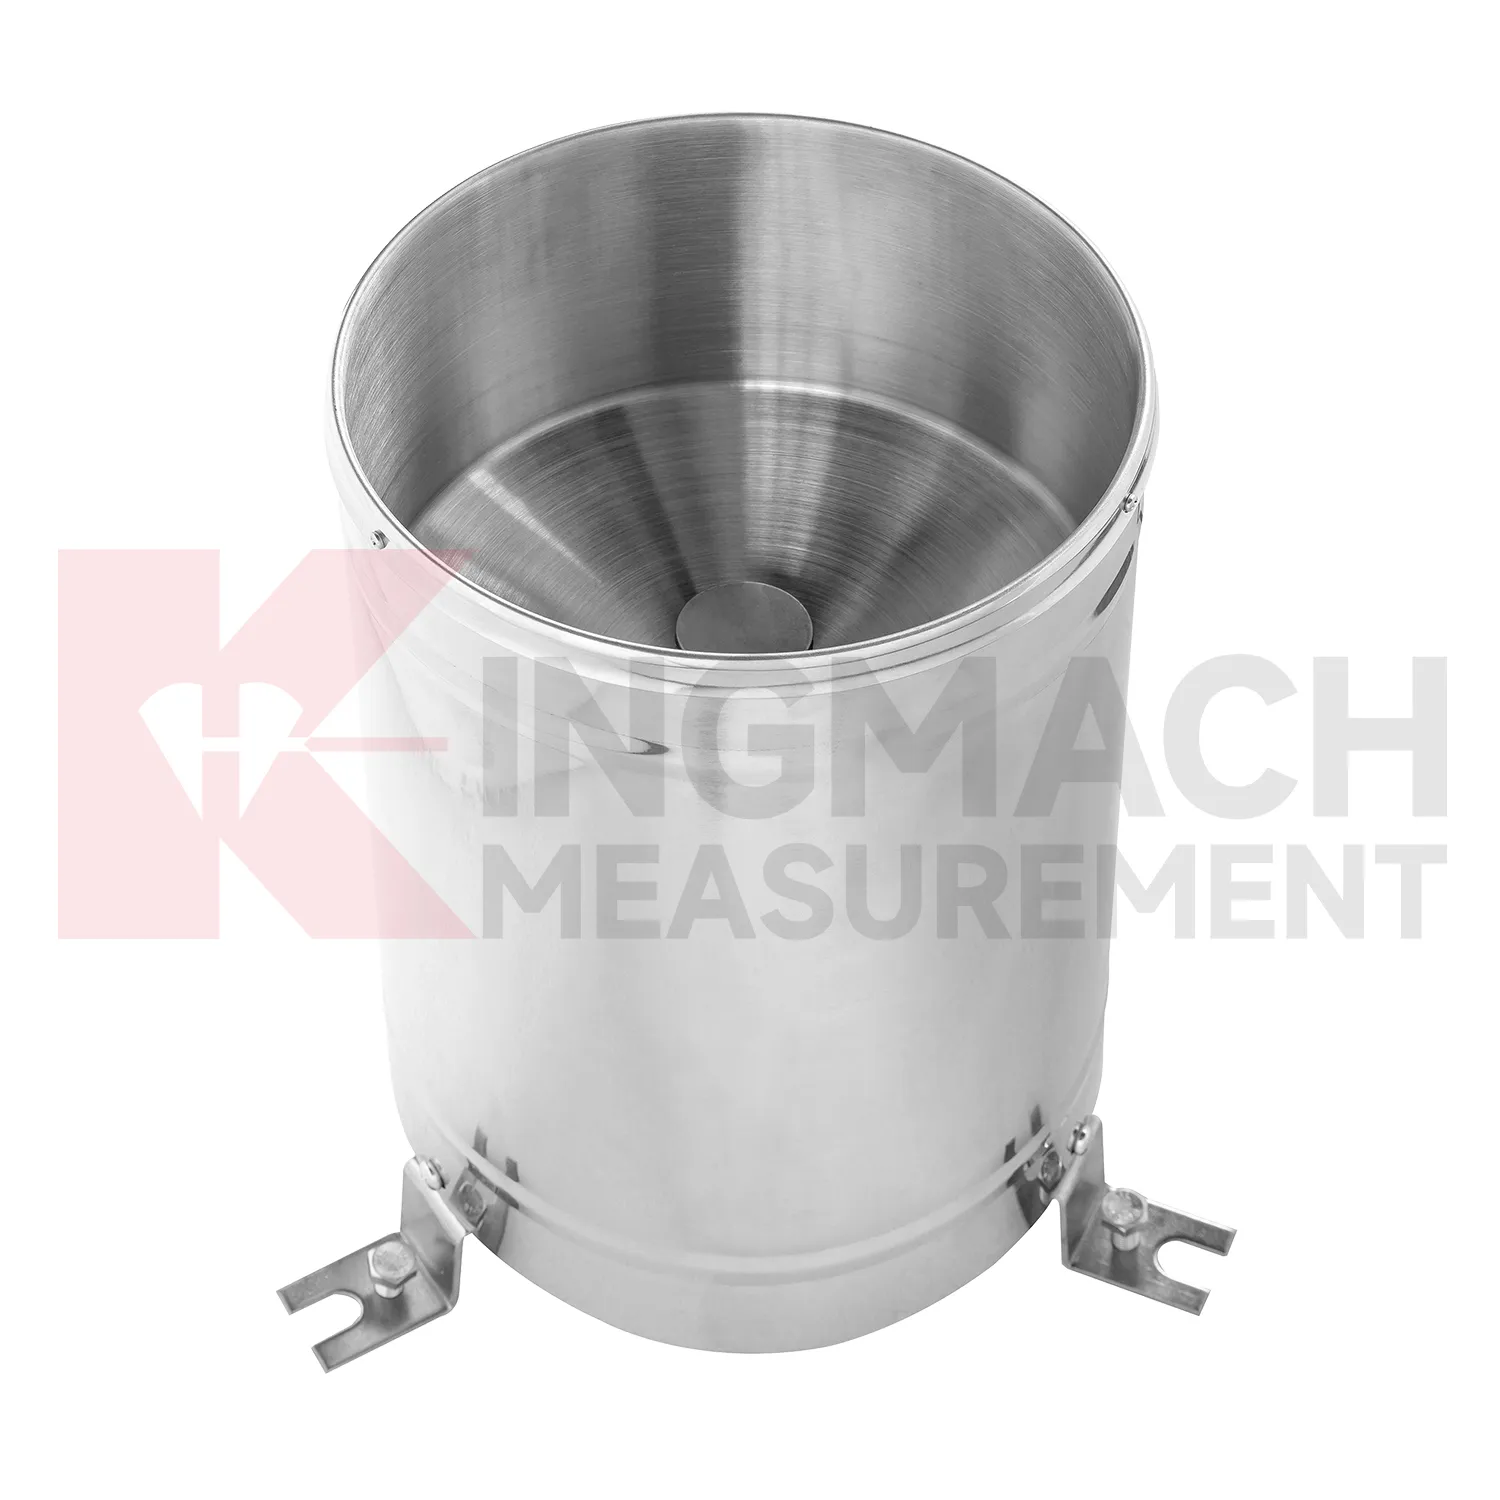
wind speed and direct sensor
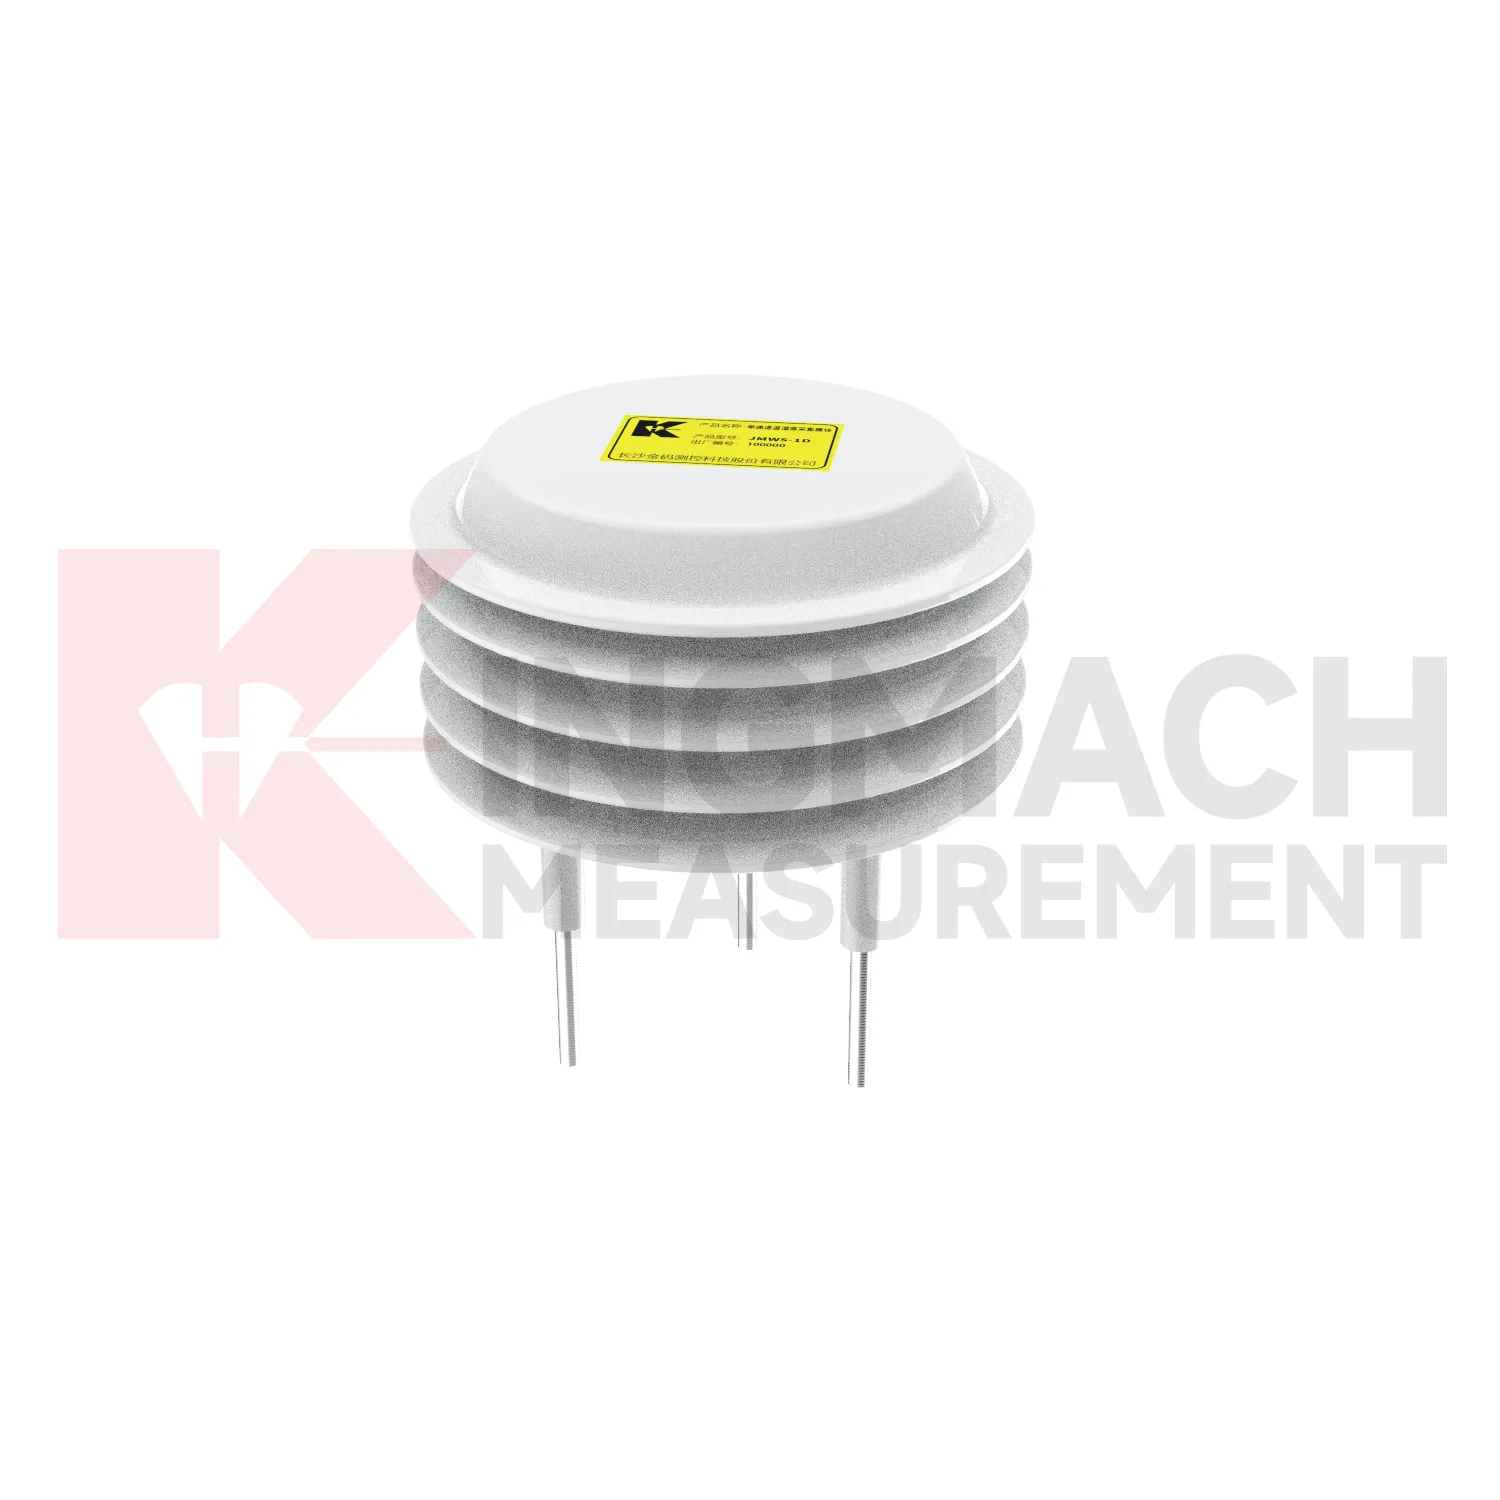
Temperature monitoring in Kingmach wind speed and direct sensor gives engineers a way to separate environmental effects from structural change. Many materials expand and contract with heat. Sensors, cables, cabinets, and enclosures also behave differently under temperature stress. In bridges, temperature can affect strain and displacement records. In tunnels, it can interact with humidity and ventilation. In industrial areas, it may follow equipment operation. In energy, transportation, railway, and construction settings, a stable temperature record helps reviewers avoid treating a thermal pattern as a structural defect. The monitoring point should be placed according to the question being asked: material temperature, air condition, cabinet environment, or general site exposure. Each placement tells a different story, and the report should make that difference clear.
A good review habit is to compare the condition channel with the nearest asset behavior instead of reading it as a standalone weather value. That keeps the record tied to slope movement, bridge response, tunnel equipment, dam seepage, drainage behavior, or cabinet reliability.
The installation file should explain why the location represents the monitored area. If the point is sheltered, shaded, exposed, buried, elevated, or placed inside an enclosure, that fact changes how later readings should be understood by maintenance staff.
During abnormal events, the first question is not only whether the value crossed a limit. The reviewer should ask what changed around the site, whether the related structure reacted, and whether a field inspection confirmed the same pattern.
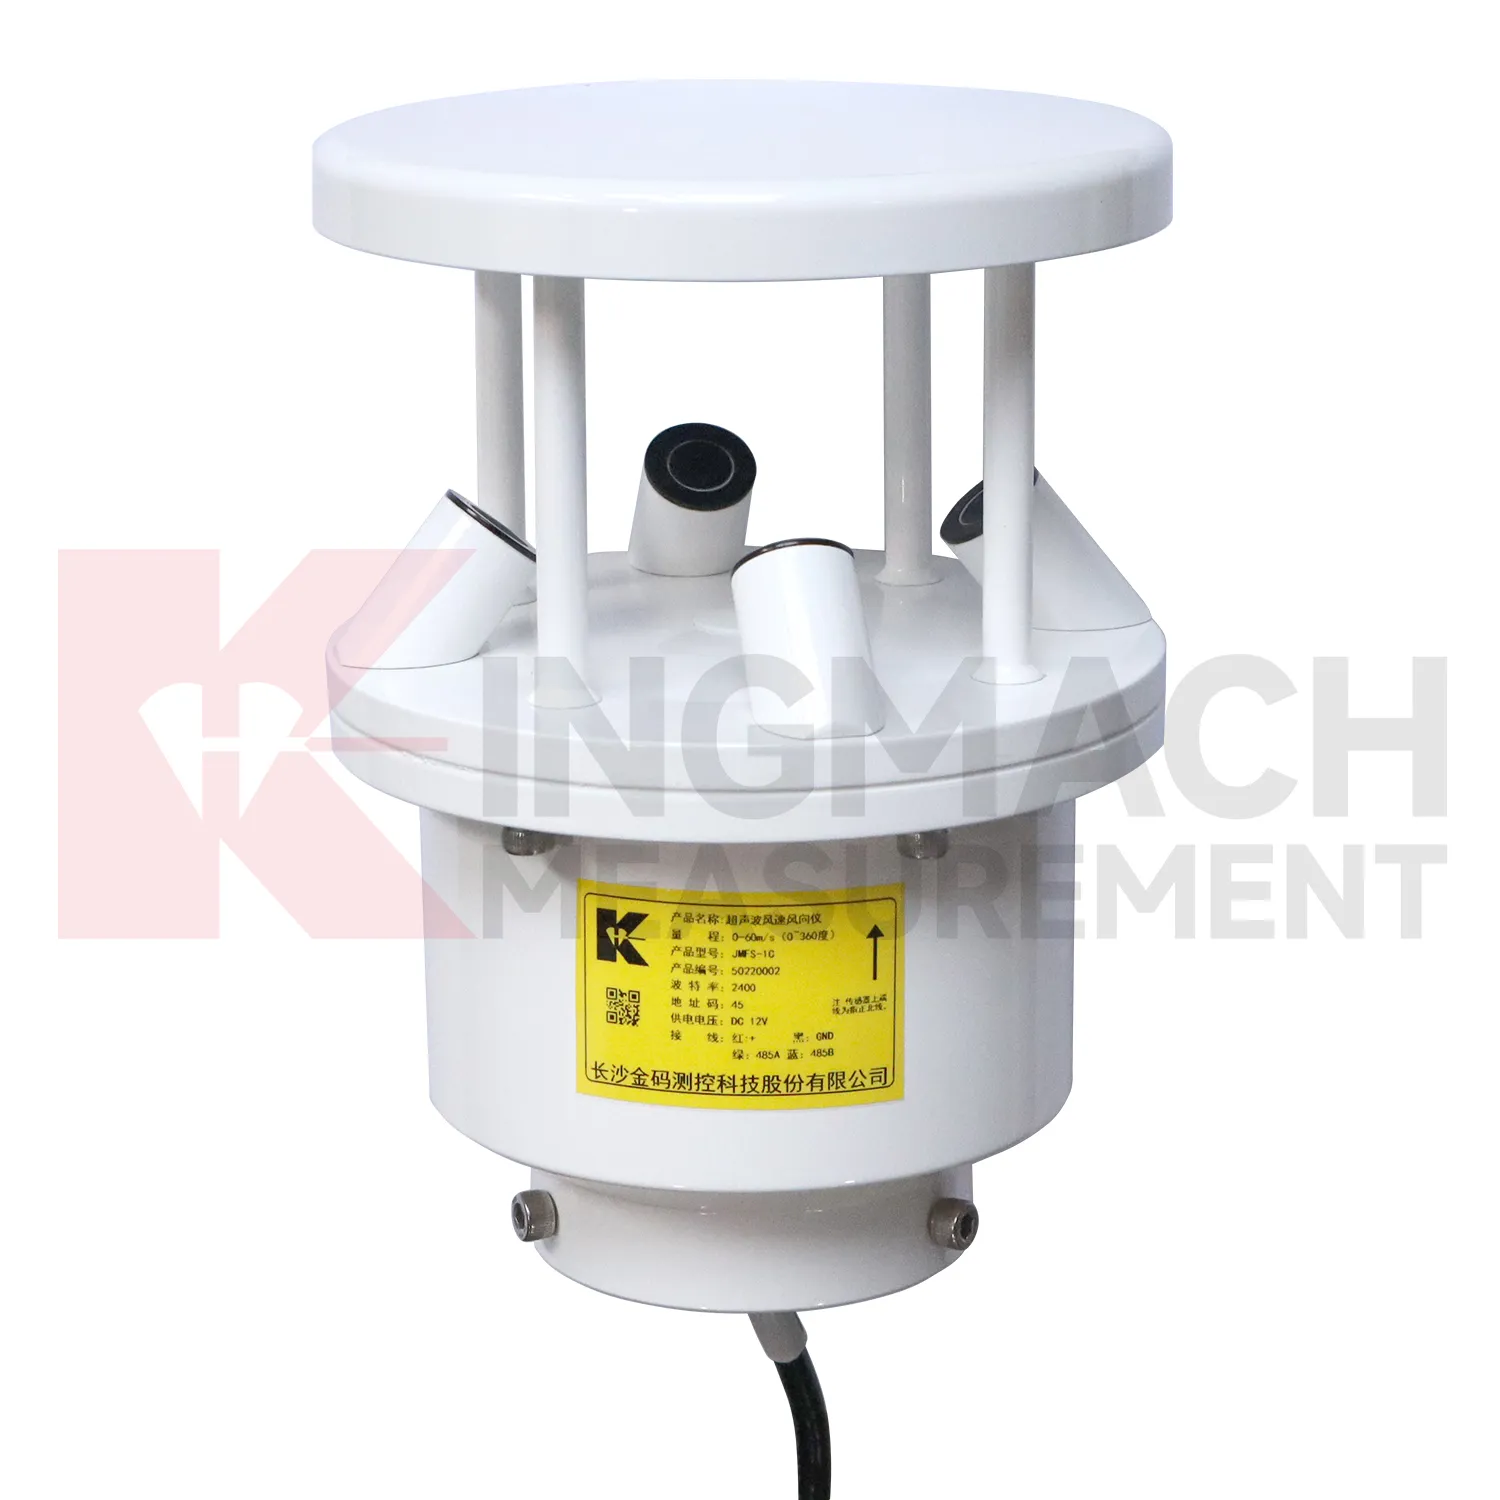
Application of wind speed and direct sensor
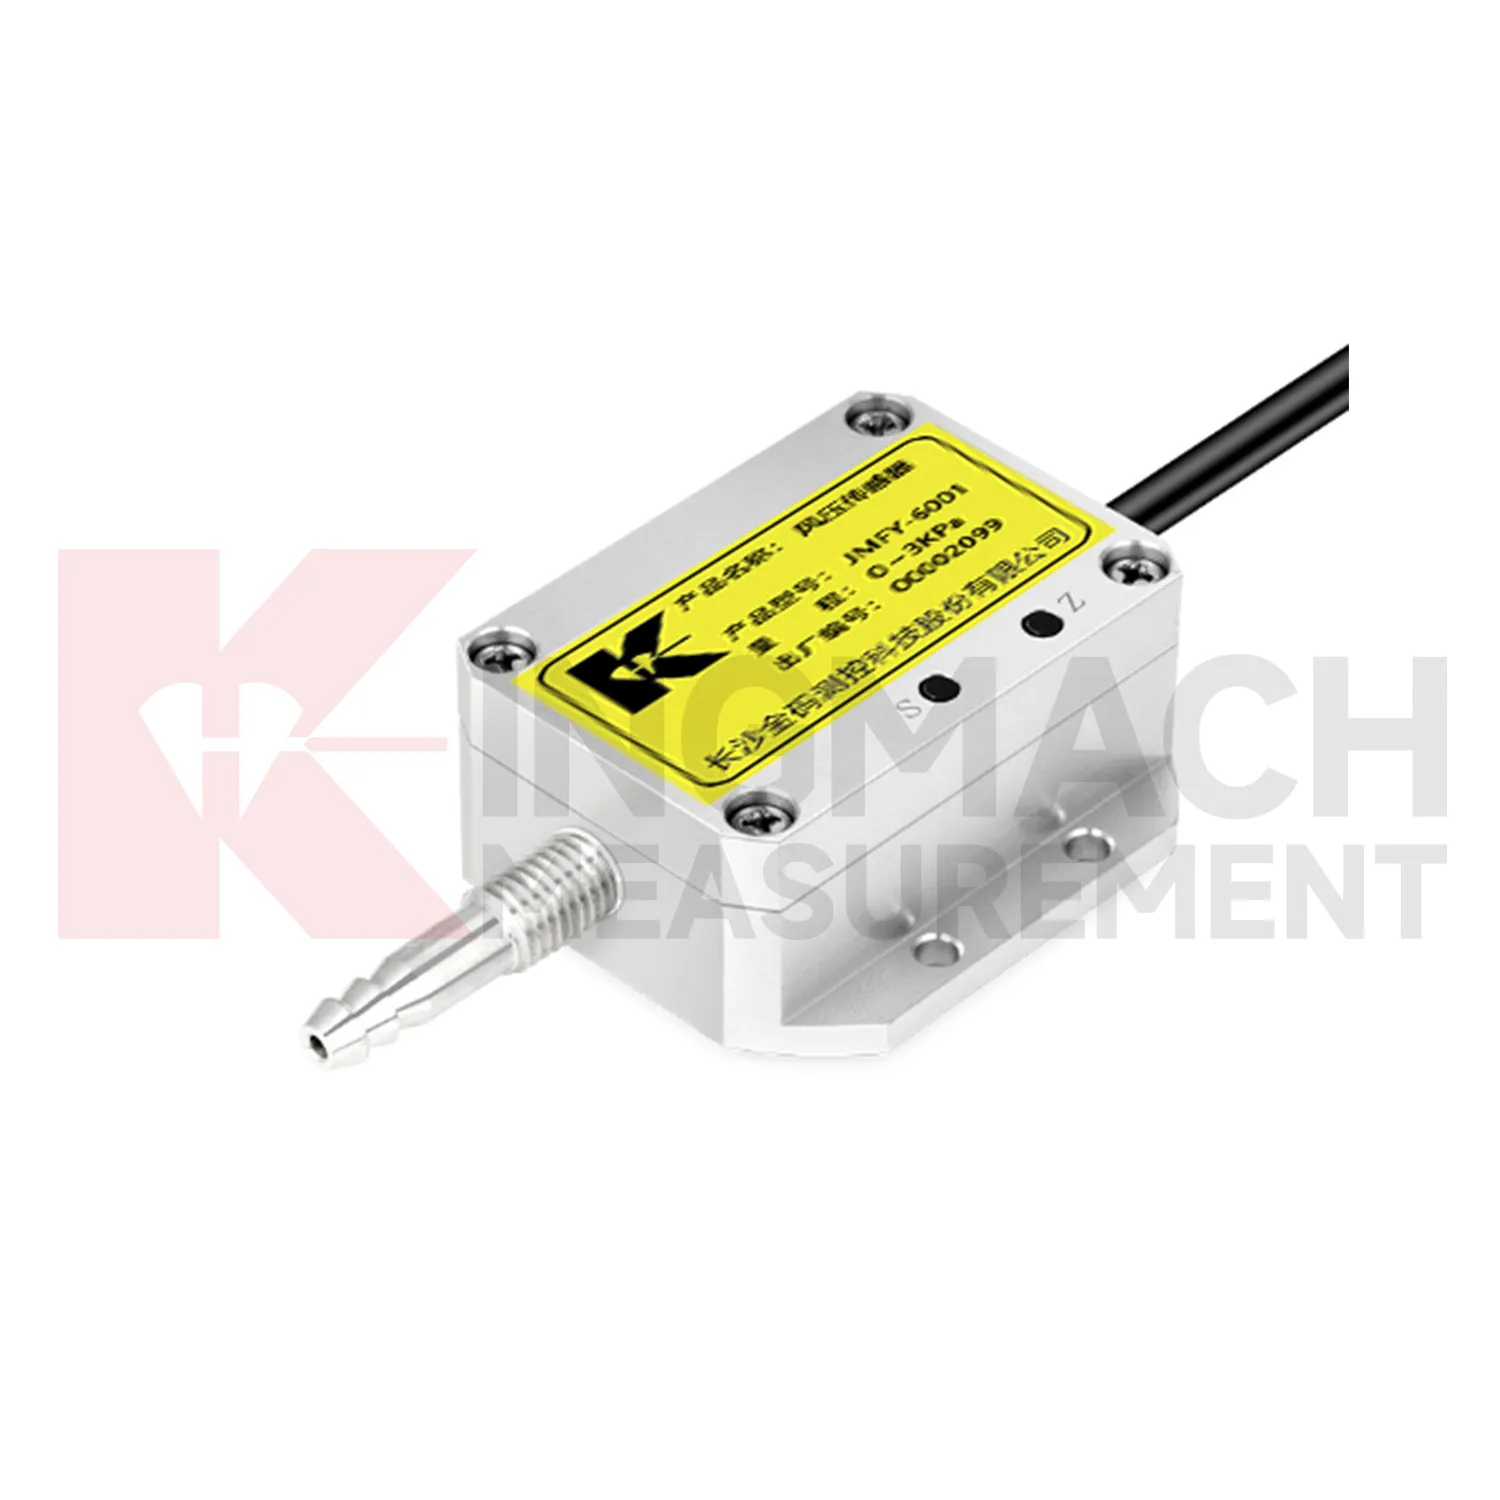
Integrated monitoring platforms use Kingmach wind speed and direct sensor as the condition layer beside structural instruments. A platform should not display environmental values as decoration. Each channel should support a review path: rainfall for slope and seepage behavior, wind for bridge and tower response, temperature for strain and expansion, humidity for cabinet reliability, pressure for airflow or wind load, and soil wetness for ground movement. Setup should define units, time alignment, alarm review, linked structural channels, and maintenance responsibilities. During an abnormal event, the reviewer should be able to compare the condition change with structural response without opening separate files. That is how environmental data becomes useful in daily operation, emergency review, and long-term asset management.
Platform design should group channels by risk rather than by instrument type. A bridge wind group, slope rainfall group, tunnel humidity group, or dam seepage group is easier for field staff to understand than a long list of unrelated values. This grouping also helps alarm review because the relevant condition and response appear together.
Permission and reporting workflows matter too. Designers may need detailed curves, maintenance staff may need station status, and owners may need a plain event summary. A well-organized platform lets each user see the environmental context needed for their decision.
The future of wind speed and direct sensor
Future Kingmach wind speed and direct sensor reporting will make abnormal-event review more traceable. A report that says a slope moved after rain should show rainfall timing, wetting response, movement rate, and inspection results together. A report that says bridge vibration rose during wind should show wind direction, wind period, structural response, and related maintenance notes. This reduces manual work and makes reports easier to defend. Environmental records should follow the same naming and time standards as structural records. When the reporting workflow is consistent, owners can compare events across seasons, assets, and maintenance teams.
The next step is report structure that follows the event, not the instrument list. A storm report should gather rain, wetting, seepage, ground movement, photographs, and field actions. A heat-related report should gather temperature, strain behavior, expansion observations, and cabinet status. This makes the document easier for owners, designers, and field crews to review together.
Traceable reporting also protects future decisions. If the same asset produces another alarm years later, the team can compare event type, measured condition, inspection result, and repair action without rebuilding the story from scattered files. That continuity is often more useful than a single high-resolution curve.
Care & Maintenance of wind speed and direct sensor
Rainfall maintenance for Kingmach wind speed and direct sensor should focus on keeping the catchment path clean and level. Leaves, dust, insects, scale, bird droppings, splash, and tilted mounting can distort rainfall records. The rain point should be inspected after storms, long dry periods, nearby earthwork, and seasonal debris build-up. Cleaning should be logged with date, condition, leveling status, and the first normal reading after work. Rainfall data is often used to explain slope movement, seepage, tunnel leakage, construction delay, or drainage performance. If the rain record is wrong, the engineering interpretation may also be wrong. Simple field care protects a much larger monitoring decision.
Maintenance teams should record cleaning, access difficulty, enclosure condition, cable repair, vegetation growth, nearby equipment changes, and the first normal reading after work. Those notes protect the meaning of the curve when old data is reviewed months later.
The environmental point should be part of a named monitoring question. It may explain wetting, drying, wind exposure, thermal movement, cabinet stress, or pressure variation, but that purpose needs to be visible in drawings and reports.
Kingmach wind speed and direct sensor
The data chain behind Kingmach wind speed and direct sensor should be as clear as the sensors themselves. Environmental channels may use different signal types, units, update intervals, and power needs. If the channel names are weak, a report may confuse rainfall with another station, wind direction with wind speed, or room humidity with cabinet humidity. Each point should have a unit, location, data path, inspection interval, and linked structural record. This prevents environmental data from being collected but ignored. During an alarm, the team should be able to open one timeline and see the condition change, the structural response, and the maintenance note. That is where environmental monitoring becomes practical.
During abnormal events, the first question is not only whether the value crossed a limit. The reviewer should ask what changed around the site, whether the related structure reacted, and whether a field inspection confirmed the same pattern.
Long-term value comes from consistency. A channel that keeps the same location, unit, maintenance history, and linked asset record can support seasonal comparison, post-storm review, and handover between construction and operation teams.
FAQ
Q: Can environmental data support asset management?
A: Yes. Long-term records help owners compare weather, exposure, maintenance events, and structural response across seasons and assets.
Q: How does it help during alarms?
A: It lets reviewers check whether a structural alarm followed rain, wind, temperature change, humidity rise, or another site condition.
Q: What should dashboards show?
A: Dashboards should link environmental channels to the structural risks they explain, rather than displaying unrelated values together.
Q: Why avoid product-list writing?
A: Readers need to understand monitoring purpose and field value; long product lists make the page harder to use and less natural.
Q: What is the best review habit?
A: Review environmental data with time-aligned structural readings, inspection notes, maintenance records, and the site event that triggered concern.
If the reading seems unusual, the team should check the physical condition of the station before drawing conclusions about the asset. Blockage, poor exposure, loose wiring, water entry, and changed surroundings can all create misleading patterns.
Reviews
Christopher Martinez
Very satisfied with the readouts & data loggers. User-friendly interface and supports multiple sensor inputs.
Michael Anderson
The strain gauges and load cells are extremely accurate and stable. They performed very well in our bridge monitoring project. Highly recommended!
Latest Inquiries
To protect the privacy of our buyers, only public service email domains like Gmail, Yahoo, and MSN will be displayed. Additionally, only a limited portion of the inquiry content will be shown.
Emma***@gmail.comCanada
Dear Sir/Madam, we are interested in displacement transducers and settlement sensors for a geotechni...
Charlotte***@gmail.comUnited Arab Emirates
Hi, we require instrumentation cables suitable for harsh environments. Could you advise on specifica...
Related product categories
- Temperature Sensor
- Chain-type Temperature Sensor
- Temperature String
- Daisy-Chained Digital Thermometer
- Single-Channel Temperature and Humidity Acquisition Module
- Environmental Monitoring
- Integrated Monitoring Station
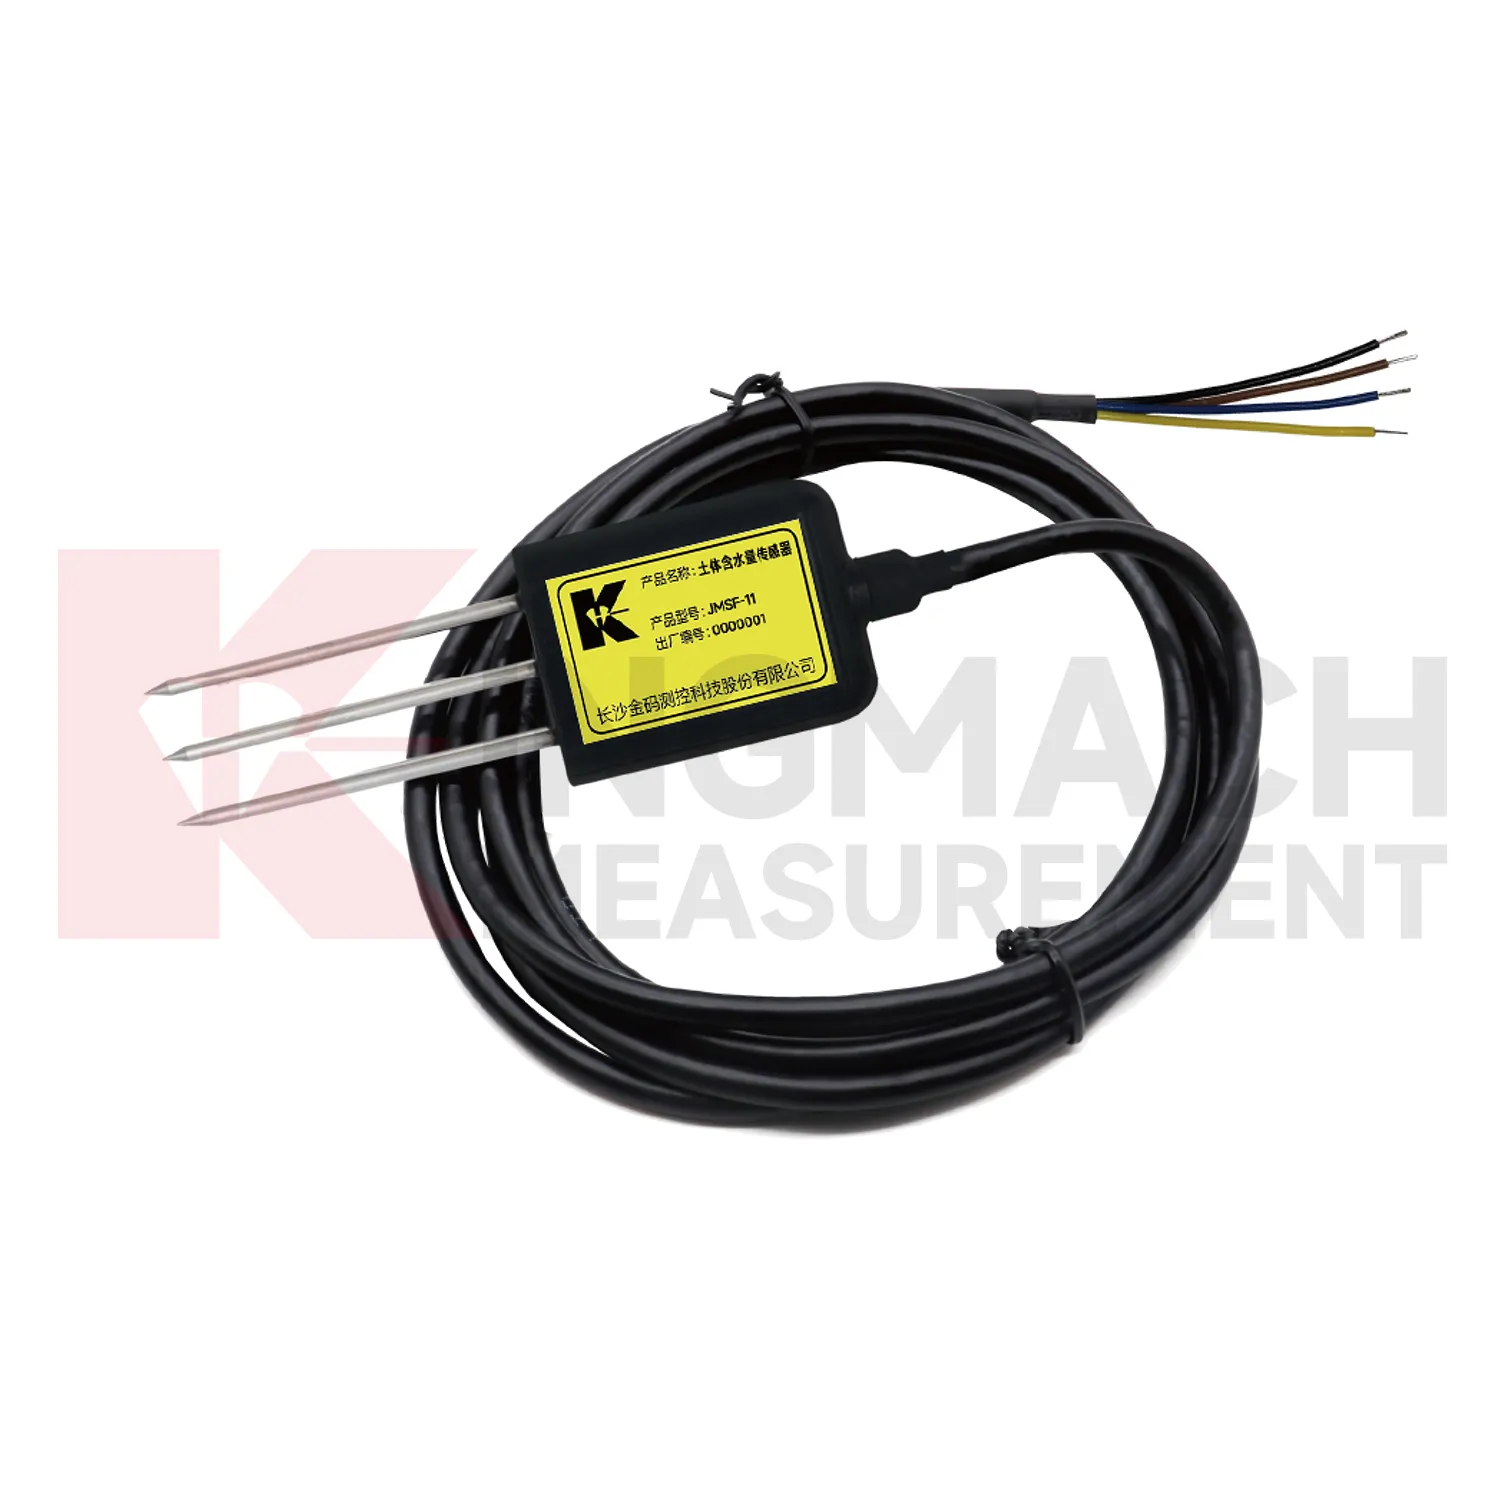
- Soil Water Content Sensor
- Ultrasonic Anemometer
- semiconductor temperature sensor
- semiconductor based temperature sensors
- semiconductor temperature sensors