 ar
ar bg
bg hr
hr cs
cs da
da nl
nl fi
fi fr
fr de
de el
el hi
hi it
it ko
ko no
no pl
pl pt
pt ro
ro ru
ru es
es sv
sv tl
tl iw
iw id
id lv
lv lt
lt sr
sr sk
sk sl
sl uk
uk vi
vi et
et hu
hu th
th tr
tr fa
fa ms
ms hy
hy ka
ka ur
ur bn
bn mn
mn ta
ta kk
kk uz
uz ku
ku
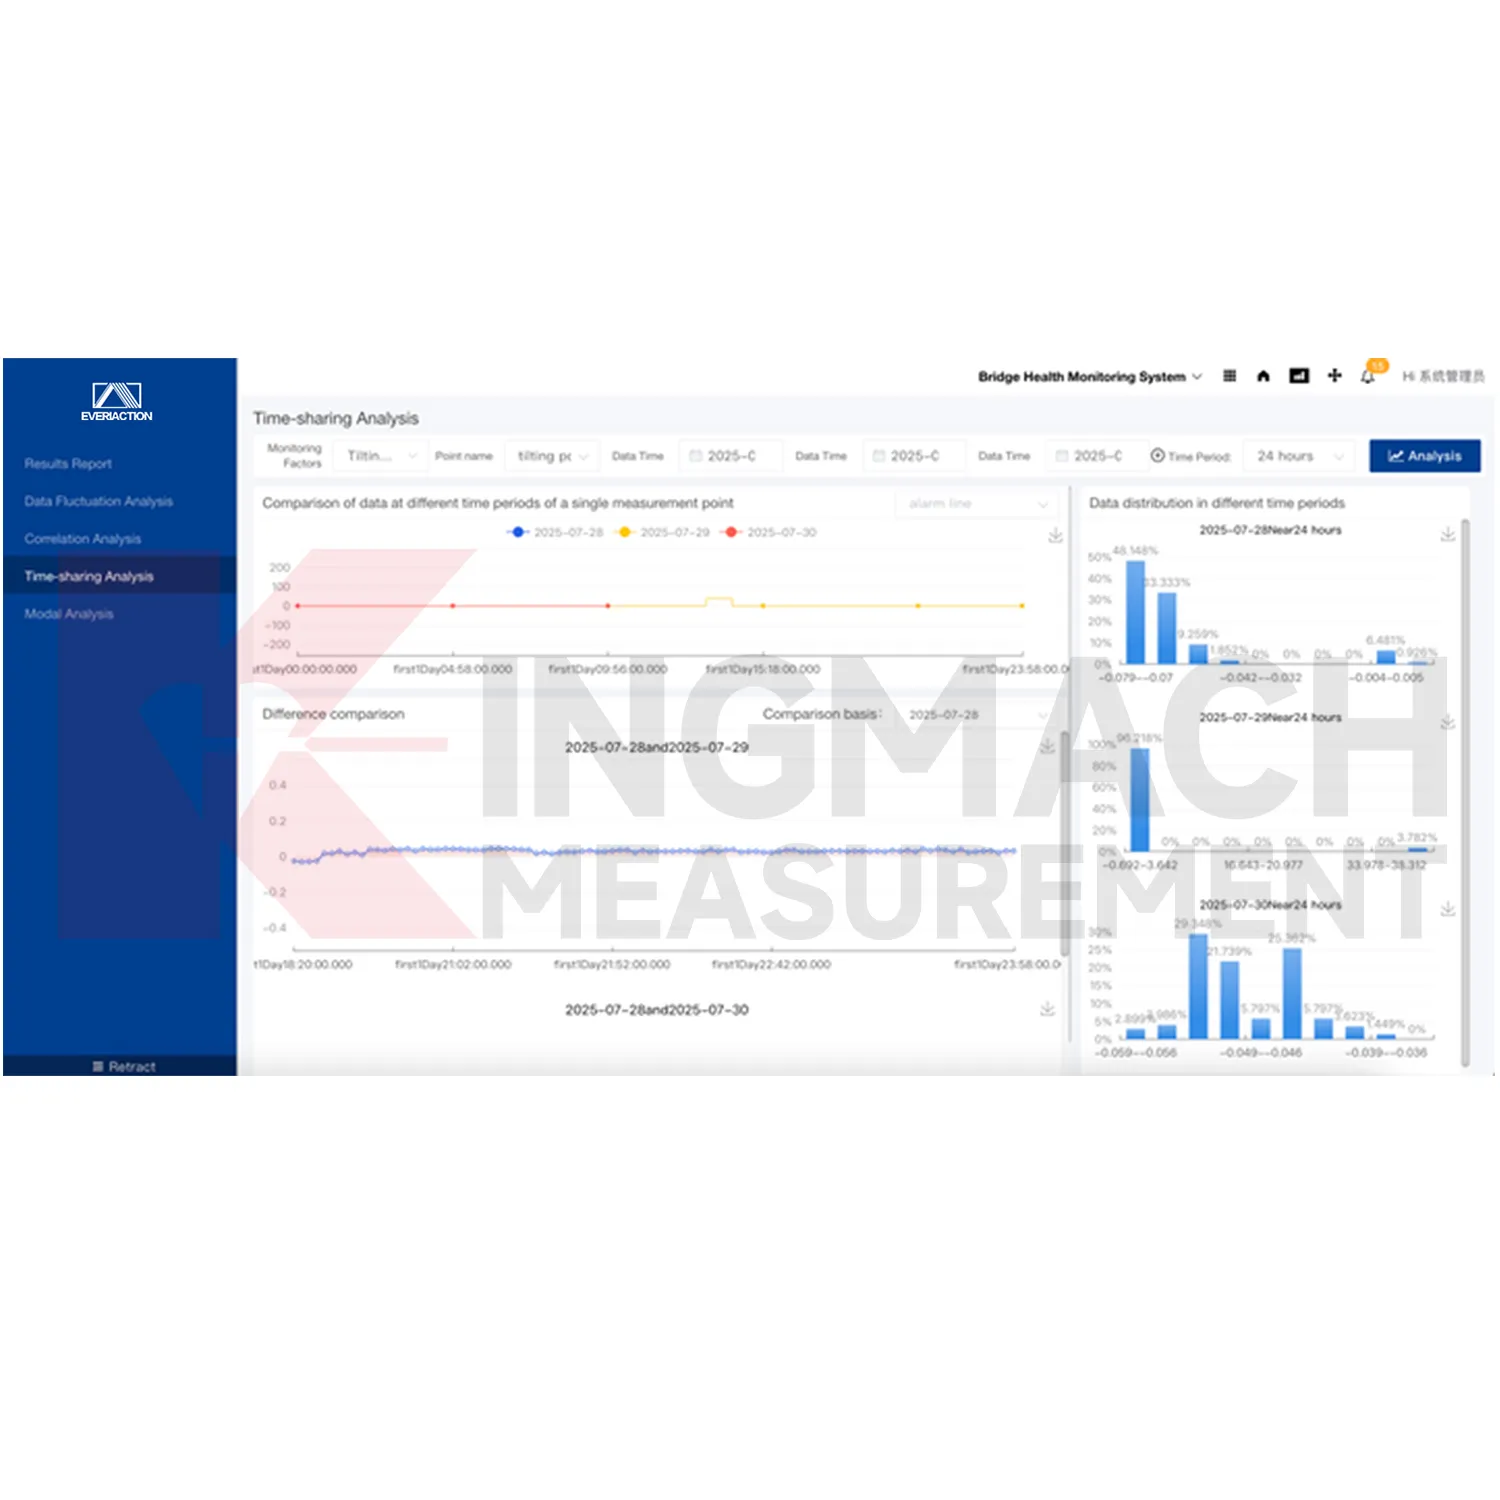
Visualization Software
The platform supports graphical display so complex monitoring data can be converted into clearer visual information. Users can review trends, abnormal early warnings, and reports through a more intuitive interface. This is important because a raw table of readings is rarely enough for quick engineering management. Graphs, alarm status, project documents, and maintenance notes help users see what has changed and what needs attention. Kingmach Visualization Software is therefore positioned as a digital management layer above the field instruments.
Application of Visualization Software
Foundation pit monitoring uses Kingmach Visualization Software to coordinate support force, displacement, settlement, groundwater, tilt, and environmental records during construction. Pit sites change quickly, and data must be reviewed alongside excavation stage, support installation, rainfall, pumping, and nearby building response. Flexible alarm rules help the team distinguish routine stage-related movement from a reading that needs inspection. Project documents and dynamic information also help later reviewers understand what was happening when a trend changed.
The future of Visualization Software
Standardized project records will shape the future of Kingmach Visualization Software. Infrastructure owners increasingly need monitoring data that can survive staff changes, contractor changes, upgrades, and long asset lifetimes. A project-based platform can keep baseline data, device information, inspection notes, alarm levels, and documents in a consistent structure. That record becomes useful years later when teams compare new behavior with earlier conditions and decide whether maintenance or deeper investigation is required.
Care & Maintenance of Visualization Software
User roles and access control are part of maintaining Kingmach Visualization Software. Owners, engineers, inspectors, operators, and report reviewers may need different permissions. Limit configuration changes to trained users and keep a record of edits to alarm rules, project information, device settings, and report layouts. This protects data integrity and makes it easier to explain later why a trend, alarm, or report changed. Good access discipline is especially important for cloud-based monitoring records.
Kingmach Visualization Software
Kingmach Visualization Software turns scattered field readings into a project view that engineers, owners, and maintenance teams can actually use. A monitoring site may include strain gauges, load cells, displacement meters, settlement sensors, tiltmeters, water-level instruments, environmental sensors, accelerometers, acquisition modules, and data loggers. Without a central platform, each channel can become a separate file or screen. The Monitoring system software platform receives and stores multi-dimensional monitoring data in real time, then presents trends, alarms, reports, and project records in a clearer form. This helps users understand the status of bridges, tunnels, slopes, buildings, dams, subgrades, and foundation pits before small changes become difficult to trace.
FAQ
Q: How should a project be prepared?
A: Define asset folders, monitoring zones, measuring points, units, alert grades, and report needs before launch.
Q: What should be tested at go-live?
A: Test incoming values, time order, engineering units, graph refresh, alarm trigger, and export output.
Q: Why does alarm logic need review?
A: Different sensor categories and risk levels may need different limits, rates, and escalation steps.
Q: How should files stay current?
A: Update drawings, point lists, photos, inspection notes, maintenance logs, and reports when the site changes.
Q: What should follow a platform update?
A: Run a short acceptance check on live values, graph pages, alerts, exports, accounts, and stored files.
Reviews
Joshua Clark
We ordered a full monitoring solution including sensors and data loggers. Everything works seamlessly together. Great supplier!
James Thompson
The tiltmeters and accelerometers are very sensitive and provide precise data. Perfect for our structural health monitoring system.
Latest Inquiries
To protect the privacy of our buyers, only public service email domains like Gmail, Yahoo, and MSN will be displayed. Additionally, only a limited portion of the inquiry content will be shown.
Amelia***@gmail.comSingapore
Hello, I am looking for visualization software for monitoring system data analysis. Please let me kn...
Olivia***@gmail.comUnited States
Hello, we are currently sourcing high-precision strain gauges and load cells for a bridge monitoring...
Related product categories
- Monitoring Software Suite
- Monitoring system software platform
- Environmental Monitoring
- Visualization Software
- GPS Displacement Monitoring System
- Integrated Monitoring Station
- Settlement Monitoring Rod
- Structural Health Monitoring (SHM) System
- Structural Monitoring Cloud Platform
- IoT Online Monitoring System
- Monitoring System Platform & Services
- Engineering Pulse Intelligent Monitoring Cloud Platform